Vodafone 2000 Annual Report Download - page 44
Download and view the complete annual report
Please find page 44 of the 2000 Vodafone annual report below. You can navigate through the pages in the report by either clicking on the pages listed below, or by using the keyword search tool below to find specific information within the annual report.-
 1
1 -
2
-
3
-
4
-
5
-
6
-
7
-
8
-
9
-
10
-
11
-
12
-
13
-
14
-
15
-
16
-
17
-
18
-
19
-
20
-
21
-
22
-
23
-
24
-
25
-
26
-
27
-
28
-
29
-
30
-
31
-
32
-
33
-
 34
34 -
 35
35 -
 36
36 -
 37
37 -
 38
38 -
 39
39 -
 40
40 -
 41
41 -
 42
42 -
 43
43 -
 44
44 -
 45
45 -
 46
46 -
 47
47 -
 48
48 -
 49
49 -
 50
50 -
 51
51 -
 52
52 -
 53
53 -
 54
54 -
55
-
56
-
57
-
58
-
59
-
60
-
61
-
62
-
63
-
64
-
65
-
66
-
67
-
68
 |
 |

Vodafone AirTouch Plc Annual Report & Accounts for the year ended 31 March 2000
42
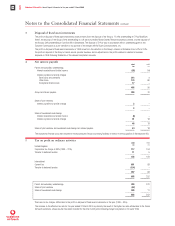
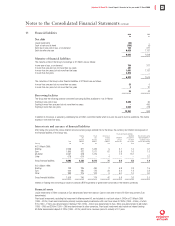
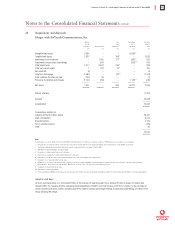
16 Financial instruments
Fair values of financial assets and liabilities
The carrying amounts and estimated fair value of the Group’s outstanding financial instruments are set out below:
2000 2000 1999 1999
Net carrying Estimated Net carrying Estimated
amount fair value amount fair value
£m £m £m £m
Fixed asset investments (excluding investments
in joint ventures and associated undertakings) 442 442 97 97
Cash at bank and in hand and liquid investments 189 189 6 6
Borrowings:
Short term 794 794 377 377
Long term 6,038 6,017 1,137 1,175
Derivative financial instruments:
Interest rate – 57 – 12
Foreign exchange – (66) – (6)
–––––– –––––– –––––– ––––––
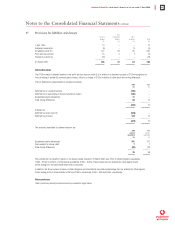
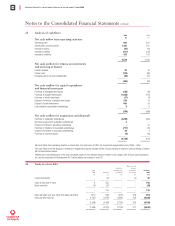
The Group’s exposure to market risk, which is the sensitivity of the value of financial instruments to changes in related currency and interest
rates, is minimised because gains and losses on the underlying assets and liabilities offset gains and losses on derivative financial instruments.
Fixed asset investments in the above table exclude £101,246m in relation to the fair value of the consideration for the acquisition of
Mannesmann AG as at 31 March 2000. The following methods and assumptions were used to estimate the fair values shown above.
Fixed asset investments (excluding investments in joint ventures and associated undertakings) – The net book value of fixed asset
investments at 31 March 2000 comprises investments recorded at an original cost of £442m (1999 – £97m), including assets with a fair
value to the Group of £384m arising as a result of the AirTouch merger. Investments include untraded equity investments in foreign companies
that are operating cellular and satellite communications services. Fixed asset investments of £442m do not include any valuation in respect of
existing customer bases or other intangible assets.
Cash at bank and in hand and liquid investments – The carrying values of cash and short term borrowings, and liquid investments,
approximate to their fair values because of the short term maturity of these instruments.
Borrowings (excluding foreign exchange contracts) – The fair value of quoted long term borrowings is based on year end mid-market
quoted prices. The fair value of other borrowings is estimated by discounting the future cash flows to net present values using appropriate
market interest and foreign currency rates prevailing at the year end.
Foreign exchange contracts and interest rate swaps and futures – The Group enters into foreign exchange contracts, interest rate swaps
and futures in order to manage its foreign currency and interest rate exposure. The fair value of these financial instruments was estimated by
discounting the future cash flows to net present values using appropriate market interest and foreign currency rates prevailing at the year end.
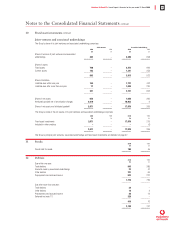
Hedges
The Group’s policy is to use derivative instruments to hedge against exposure to movements in interest rates and exchange rates. Changes in
the fair value of instruments used for hedging are not recognised in the financial statements until the hedged exposure is itself recognised.
Unrecognised gains and losses on instruments used for hedging are set out below: Total net
Gains Losses gains/(losses)
£m £m £m
Unrecognised gains and losses on hedges at 1 April 1999 22 (16) 6
Less: gains and losses arising in previous years that
were recognised in the year (5) 16 11
–––––– –––––– ––––––
Gains and losses arising before 1 April 1999 that were
not recognised at 31 March 2000 17 – 17
Gains and losses arising in the year that were
not recognised at 31 March 2000 71 (97) (26)
–––––– –––––– ––––––
Unrecognised gains and losses on hedges at 31 March 2000 88 (97) (9)
–––––– –––––– ––––––
Of which:
Gains and losses expected to be recognised in 2000 86 (97) (11)
Gains and losses expected to be recognised in 2001 or later 2 – 2
Currency exposures
Taking into account the effect of forward contracts and other derivative instruments, the Group did not have a material financial exposure to
foreign exchange gains or losses on monetary assets and monetary liabilities denominated in foreign currencies at 31 March 2000.
Further details regarding the Group’s Treasury Management and Policies are included in the Financial Review on pages 10 to 14.
Notes to the Consolidated Financial Statements continued