Vodafone 2000 Annual Report Download - page 32
Download and view the complete annual report
Please find page 32 of the 2000 Vodafone annual report below. You can navigate through the pages in the report by either clicking on the pages listed below, or by using the keyword search tool below to find specific information within the annual report.-
 1
1 -
2
-
3
-
4
-
5
-
6
-
7
-
8
-
9
-
10
-
11
-
12
-
13
-
14
-
15
-
16
-
17
-
18
-
19
-
20
-
21
-
 22
22 -
 23
23 -
 24
24 -
 25
25 -
 26
26 -
 27
27 -
 28
28 -
 29
29 -
 30
30 -
 31
31 -
 32
32 -
 33
33 -
 34
34 -
 35
35 -
 36
36 -
 37
37 -
 38
38 -
 39
39 -
 40
40 -
 41
41 -
 42
42 -
43
-
44
-
45
-
46
-
47
-
48
-
49
-
50
-
51
-
52
-
53
-
54
-
55
-
56
-
57
-
58
-
59
-
60
-
61
-
62
-
63
-
64
-
65
-
66
-
67
-
68
 |
 |

Vodafone AirTouch Plc Annual Report & Accounts for the year ended 31 March 2000
30
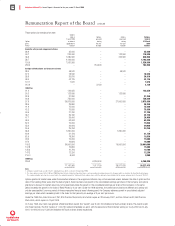
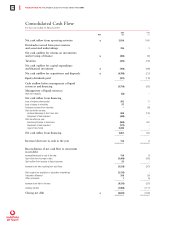
Consolidated Cash Flow
for the year ended 31 March 2000
2000 1999
Note £m £m
Net cash inflow from operating activities 25 2,510 1,045
Dividends received from joint ventures
and associated undertakings 236 3
Net cash outflow for returns on investments
and servicing of finance 25 (406) (90)
Taxation (325) (195)
Net cash outflow for capital expenditure
and financial investment 25 (756) (688)
Net cash outflow for acquisitions and disposals 25 (4,756) (317)
Equity dividends paid (221) (118)
–––––––– ––––––––
Cash outflow before management of liquid
resources and financing (3,718) (360)
Management of liquid resources
Short term deposits (33) –
Net cash inflow from financing
Issue of ordinary share capital 362 11
Issue of shares to minorities 37 –
Purchase of shares from minorities –(18)
Debt due within one year:
Increase/(decrease) in short term debt 598 (130)
Repayment of debt acquired (449) –
Debt due after one year:
(Decrease)/increase in bank loans (550) 490
Repayment of debt acquired (377) –
Issue of new bonds 4,246 –
–––––––– ––––––––
Net cash inflow from financing 3,867 353
–––––––– ––––––––
Increase/(decrease) in cash in the year 116 (7)
–––––––– ––––––––
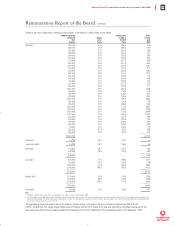
Reconciliation of net cash flow to movement
in net debt
Increase/(decrease) in cash in the year 116 (7)
Cash inflow from increase in debt (3,468) (360)
Cash outflow from increase in liquid resources 33 –
–––––––– ––––––––
Increase in net debt resulting from cash flows (3,319) (367)
Debt acquired on acquisition of subsidiary undertakings (2,133) –
Translation difference 316 (19)
Other movements 1(5)
–––––––– ––––––––
Increase in net debt in the year (5,135) (391)
Opening net debt (1,508) (1,117)
–––––––– ––––––––
Closing net debt 26 (6,643) (1,508)
–––––––– ––––––––