Vodafone 2000 Annual Report Download - page 41
Download and view the complete annual report
Please find page 41 of the 2000 Vodafone annual report below. You can navigate through the pages in the report by either clicking on the pages listed below, or by using the keyword search tool below to find specific information within the annual report.-
 1
1 -
2
-
3
-
4
-
5
-
6
-
7
-
8
-
9
-
10
-
11
-
12
-
13
-
14
-
15
-
16
-
17
-
18
-
19
-
20
-
21
-
22
-
23
-
24
-
25
-
26
-
27
-
28
-
29
-
30
-
 31
31 -
 32
32 -
 33
33 -
 34
34 -
 35
35 -
 36
36 -
 37
37 -
 38
38 -
 39
39 -
 40
40 -
 41
41 -
 42
42 -
 43
43 -
 44
44 -
 45
45 -
 46
46 -
 47
47 -
 48
48 -
 49
49 -
 50
50 -
 51
51 -
52
-
53
-
54
-
55
-
56
-
57
-
58
-
59
-
60
-
61
-
62
-
63
-
64
-
65
-
66
-
67
-
68
 |
 |

Vodafone AirTouch Plc Annual Report & Accounts for the year ended 31 March 2000 39
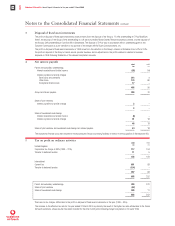
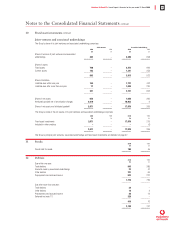
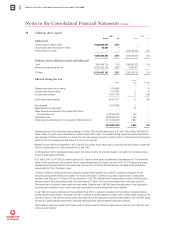
10 Fixed asset investments continued
Joint ventures and associated undertakings
The Group’s share of its joint ventures and associated undertakings comprises:
Joint ventures Associated undertakings
2000 1999 2000 1999
£m £m £m £m
Share of turnover of joint ventures and associated
undertakings 362 –3,286 698
–––––––– –––––––– –––––––– ––––––––
Share of assets
Fixed assets 790 –2,472 669
Current assets 103 –1,341 253
–––––––– –––––––– –––––––– ––––––––
893 –3,813 922
–––––––– –––––––– –––––––– ––––––––
Share of liabilities
Liabilities due within one year 164 –1,737 442
Liabilities due after more than one year 77 –1,020 220
–––––––– –––––––– –––––––– ––––––––
241 –2,757 662
–––––––– –––––––– –––––––– ––––––––
Share of net assets 652 –1,056 260
Attributed goodwill net of amortisation charges 2,019 –16,923 9
–––––––– –––––––– –––––––– ––––––––
Share of net assets and attributed goodwill 2,671 –17,979 269
–––––––– –––––––– –––––––– ––––––––
The Group’s share of the net assets of its joint ventures and associated undertakings comprises:
2000 1999 2000 1999
£m £m £m £m
Fixed asset investments 2,671 –17,979 275
Included in other creditors –––(6)
–––––––– –––––––– –––––––– ––––––––
2,671 –17,979 269
–––––––– –––––––– –––––––– ––––––––
The Group’s principal joint ventures, associated undertakings and fixed asset investments are detailed on page 57.
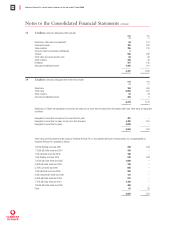
11 Stocks 2000 1999
£m £m
Goods held for resale 190 45
–––––––– ––––––––
12 Debtors 2000 1999
£m £m
Due within one year:
Trade debtors 943 385
Amounts owed by associated undertakings 23 47
Other debtors 221 66
Prepayments and accrued income 532 227
–––––––– ––––––––
1,719 725
–––––––– ––––––––
Due after more than one year:
Trade debtors 34 –
Other debtors 10 2
Prepayments and accrued income 46 14
Deferred tax (note 17) 329 –
–––––––– ––––––––
419 16
–––––––– ––––––––
2,138 741
–––––––– ––––––––
Notes to the Consolidated Financial Statements continued