Vodafone 2000 Annual Report Download - page 13
Download and view the complete annual report
Please find page 13 of the 2000 Vodafone annual report below. You can navigate through the pages in the report by either clicking on the pages listed below, or by using the keyword search tool below to find specific information within the annual report.-
 1
1 -
2
-
 3
3 -
 4
4 -
 5
5 -
 6
6 -
 7
7 -
 8
8 -
 9
9 -
 10
10 -
 11
11 -
 12
12 -
 13
13 -
 14
14 -
 15
15 -
 16
16 -
 17
17 -
 18
18 -
 19
19 -
 20
20 -
 21
21 -
 22
22 -
 23
23 -
24
-
25
-
26
-
27
-
28
-
29
-
30
-
31
-
32
-
33
-
34
-
35
-
36
-
37
-
38
-
39
-
40
-
41
-
42
-
43
-
44
-
45
-
46
-
47
-
48
-
49
-
50
-
51
-
52
-
53
-
54
-
55
-
56
-
57
-
58
-
59
-
60
-
61
-
62
-
63
-
64
-
65
-
66
-
67
-
68
 |
 |

Vodafone AirTouch Plc Annual Report & Accounts for the year ended 31 March 2000 11
Pro forma total Group operating profit
Pro forma total Group operating profit increased by 30% from £2,260m
to £2,942m, before goodwill and exceptional reorganisation costs.
Pro forma total Group operating profit for EMEA, before goodwill, and
including the Group’s share of associated undertakings, increased by
34% to £1,321m. This growth reflects strong trading throughout the
region, in particular by subsidiaries in Egypt, the Netherlands and
Sweden, and by associated undertakings in Germany, Italy, South Africa
and Spain. This was offset by a reduction in operating profit in France
due to high connection costs incurred on customer growth in SFR.
In the UK, total operating profit, before goodwill, increased by £62m to
£706m. This growth in operating profit is after connection costs on
record customer growth, 50% higher than last year, and tariff
reductions.
The United States & Asia Pacific region reported a pro forma increase of
45% in total Group operating profit to £915m, before goodwill, and
exceptional reorganisation costs of £30m incurred in the US following
the merger with AirTouch. The increase in operating profit reflects strong
organic growth in Australasia and Japan, the impact of stake increases
in Japan and the first full year of results from New Zealand. These
factors are offset by the cost of migrating US customers from analogue
to digital, with 40% of customers now on digital tariffs compared to
22% last year.
Movements in exchange rates had an adverse impact of £21m on the
increase in pro forma total Group operating profit. The adverse effect of
exchange rate movements from the strength of sterling against the Euro
was partially offset by compensating exchange rate movements against
the US Dollar and Yen.
Pro forma proportionate EBITDA
Pro forma proportionate EBITDA increased by 30% from £3,046m to
£3,948m. Proportionate EBITDA is defined as operating profit before
exceptional reorganisation costs, plus depreciation and amortisation of
subsidiaries, joint ventures, associated undertakings and investments,
proportionate to equity stakes.
Future results
There are many factors that will influence the Group’s future
performance, the most significant of these being the integration of the
Mannesmann telecommunications’ businesses into the Group and the
further development of the Group’s multi-access Internet portal.
Factors affecting future turnover and profit performance are the
potential for growth of mobile telecommunications markets, the
Group’s market share, revenue per customer, the costs of providing
and selling existing services, and start up costs of new businesses
and products including those dependent on the build and roll-out of
3G networks.
The global market for mobile telecommunications continues to provide
the potential for significant growth. Mobile telephony is expected to
substitute for fixed line networks in both voice and data services for the
consumer and then be enriched to provide services that have never
been available to users before. In addition, the development of multi-
access Internet portals will provide customers with the communication
facilities to enhance and improve their lives.
Balance sheet
Fixed assets
Total fixed assets have increased in the year from £2,851m to
£150,851m at 31 March 2000.
£41,379m of this increase is in relation to goodwill, net of amortisation
charges, arising on acquisitions and investments in new businesses
completed during the year, which has been capitalised and amortised
in accordance with the Group’s accounting policies. During the year,
£21,789m of goodwill (net of amortisation) has been capitalised within
intangible fixed assets in relation to acquired subsidiaries, with a
further £19,590m being allocated to investments in joint ventures and
associated undertakings. Included in these amounts is goodwill arising
on the merger with AirTouch, provisionally calculated as £41.0 billion.
This is being amortised primarily by reference to the unexpired licence
period and conditions for licence renewal of the underlying acquired
network businesses, with the amortisation periods ranging between
8 and 40 years.
The Group’s investments, which include equity investments and loans
advanced to associated undertakings and other investments, increased
by £121,966m in the year as shown in the table below.
Movements in fixed asset investments £m
At 1 April 1999 372
Acquisition of Mannesmann AG 101,246
New investments, including goodwill of £19,590m 20,999
Other movements (279)
–––––––––
At 31 March 2000 122,338
–––––––––
The investment of £101,246m in respect of Mannesmann AG
represents the ordinary shares issued to the shareholders and
convertible bond holders of Mannesmann AG at 31 March 2000.
This follows the receipt of valid acceptances representing approximately
98.62% of the issued share capital of the company, and 99.72% of its
convertible bond, at 27 March 2000, the date that the Company’s Offer
closed. The Mannesmann acquisition completed on 12 April 2000, the
date that clearance was received from the European Commission.
Tangible fixed assets increased by £4,157m during the year, primarily
in relation to the merger with AirTouch and continued capital investment
in the Group’s worldwide network operations.
Financial Review continued
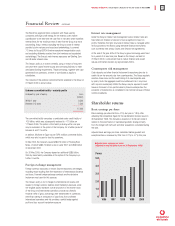
Average exchange rates
Year to Year to Percentage
31 March 31 March change
Currency 2000 1999 %
Euro 1.57 n/a n/a
German Mark 3.06 2.89 5.9
Italian Lire 3,032 2,854 6.2
Greek Drachma 514 489 5.1
Japanese Yen 178.2 213.3 (16.5)
Swedish Krona 13.6 13.2 3.0
US Dollar 1.61 1.66 (3.0)