Vodafone 2000 Annual Report Download - page 27
Download and view the complete annual report
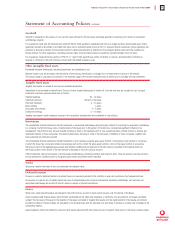
Please find page 27 of the 2000 Vodafone annual report below. You can navigate through the pages in the report by either clicking on the pages listed below, or by using the keyword search tool below to find specific information within the annual report.-
 1
1 -
2
-
3
-
4
-
5
-
6
-
7
-
8
-
9
-
10
-
11
-
12
-
13
-
14
-
15
-
16
-
 17
17 -
 18
18 -
 19
19 -
 20
20 -
 21
21 -
 22
22 -
 23
23 -
 24
24 -
 25
25 -
 26
26 -
 27
27 -
 28
28 -
 29
29 -
 30
30 -
 31
31 -
 32
32 -
 33
33 -
 34
34 -
 35
35 -
 36
36 -
 37
37 -
38
-
39
-
40
-
41
-
42
-
43
-
44
-
45
-
46
-
47
-
48
-
49
-
50
-
51
-
52
-
53
-
54
-
55
-
56
-
57
-
58
-
59
-
60
-
61
-
62
-
63
-
64
-
65
-
66
-
67
-
68
 |
 |

Vodafone AirTouch Plc Annual Report & Accounts for the year ended 31 March 2000 25
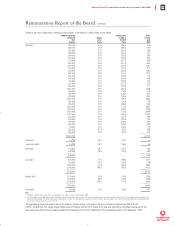
Details of the options exercised by directors of the Company in the year to 31 March 2000 are as follows:
Options exercised Market price Gross
during the Option at date of pre-tax
year price exercise gain
Number Pence Pence £000
Sam Ginn 137,000 37.6 348.0 426
250,000 37.6 349.5 780
130,000 37.6 342.5 396
250,000 37.6 344.5 767
230,000 37.6 338.5 692
270,000 37.6 339.0 814
200,000 37.6 341.5 608
500,000 37.6 342.0 1,522
670,000 37.6 343.0 2,047
100,000 37.6 312.0 274
500,000 37.6 345.5 1,540
360,000 37.6 347.0 1,114
250,000 37.6 319.0 704
156,000 37.6 336.0 465
50,000 37.6 319.5 141
100,000 37.6 317.0 279
250,000 37.6 324.5 717
1,344,000 37.6 335.5 4,003
250,000 37.6 318.5 702
133,000 37.6 348.0 413
620,000 37.6 346.5 1,914
3,425,000 37.6 281.0 8,333
250,000 37.6 355.5 795
250,000 37.6 369.5 830
2,500,000 37.6 272.0 5,862
1,000,000 37.6 363.0 3,254
2,500,000 37.6 273.5 5,893
4,075,000 37.6 286.0 10,124
250,000 37.6 357.0 799
225,000 37.6 352.5 708
250,000 37.6 366.5 822
500,000 37.6 364.0 1,633
25,000 37.6 353.5 79
250,000 37.6 373.0 838
250,000 37.6 354.0 791
––––––––– –––––––––
22,500,000 61,079
––––––––– –––––––––
Chris Gent 24,285 28.4 276.0 60
––––––––– –––––––––
Julian Horn-Smith 24,285 28.4 258.0 56
––––––––– –––––––––
Ken Hydon 123,500 46.7 275.0 282
432,500 48.3 275.0 982
––––––––– –––––––––
556,000 1,264
––––––––– –––––––––
Arun Sarin 875,000 37.6 285.5 2,171
750,000 37.6 273.5 1,768
1,500,000 37.6 284.0 3,694
5,000,000 100.2 282.5 9,120
––––––––– –––––––––
8,125,000 16,753
––––––––– –––––––––
Mohan Gyani 1,375,000 37.6 273.0 3,238
1,250,000 68.3 273.0 2,559
5,000,000 100.2 273.0 8,644
––––––––– –––––––––
7,625,000 14,441
––––––––– –––––––––
Paul Hazen 123,050 24.2 233.0 257
––––––––– –––––––––
Note
1. All figures restated to take account of the 4:1 capitalisation issue which occurred on 30 September 1999.
2. The share options exercised by Sam Ginn, Arun Sarin, Mohan Gyani and Paul Hazen were in respect of American Depositary Shares, each representing ten ordinary shares of the Company, which are traded on the
New York Stock Exchange. The number, option price and market price have been converted into the equivalent amounts for Vodafone AirTouch ordinary shares, with the option and market prices being translated at
the average exchange rate for the year of $1.61:£1.
The aggregate gross pre-tax gains made on the exercise of share options in the year by the above Company’s directors was £93,910,000
(1999 – £6,963,000). The closing middle market price of Vodafone AirTouch Plc’s shares at the year end was 348.5p, its highest closing price in the
year having been 399.0p and its lowest closing price having been 204.0p (after adjustment for the capitalisation issue on 30 September 1999).
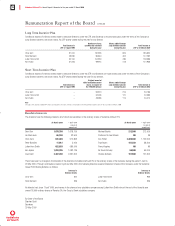
Remuneration Report of the Board continued