Virgin Media 2014 Annual Report Download - page 9
Download and view the complete annual report
Please find page 9 of the 2014 Virgin Media annual report below. You can navigate through the pages in the report by either clicking on the pages listed below, or by using the keyword search tool below to find specific information within the annual report.-
 1
1 -
 2
2 -
 3
3 -
 4
4 -
 5
5 -
 6
6 -
 7
7 -
 8
8 -
 9
9 -
 10
10 -
 11
11 -
 12
12 -
 13
13 -
 14
14 -
 15
15 -
 16
16 -
 17
17 -
 18
18 -
 19
19 -
 20
20 -
21
-
22
-
23
-
24
-
25
-
26
-
27
-
28
-
29
-
30
-
31
-
32
-
33
-
34
-
35
-
36
-
37
-
38
-
39
-
40
-
41
-
42
-
43
-
44
-
45
-
46
-
47
-
48
-
49
-
50
-
51
-
52
-
53
-
54
-
55
-
56
-
57
-
58
-
59
-
60
-
61
-
62
-
63
-
64
-
65
-
66
-
67
-
68
-
69
-
70
-
71
-
72
-
73
-
74
-
75
 |
 |

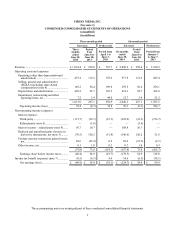
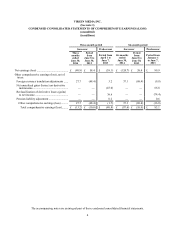
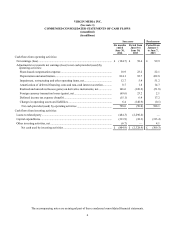
The accompanying notes are an integral part of these condensed consolidated financial statements.
7
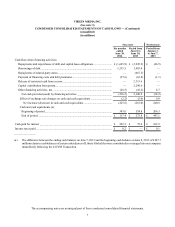
VIRGIN MEDIA INC.
(See note 1)
CONDENSED CONSOLIDATED STATEMENTS OF CASH FLOWS — (Continued)
(unaudited)
(in millions)
Successor Predecessor
Six months
ended
June 30,
2014
Period from
June 8 to
June 30,
2013
Period from
January 1
to June 7,
2013
Cash flows from financing activities:
Repayments and repurchases of debt and capital lease obligations.......................... £(1,665.9) £ (3,945.2) £ (46.5)
Borrowings of debt.................................................................................................... 1,535.5 1,983.4 —
Repayments of related-party notes............................................................................ —(467.5) —
Payment of financing costs and debt premiums........................................................ (57.6)(63.8)(1.1)
Release of restricted cash from escrow..................................................................... — 2,313.6 —
Capital contribution from parent............................................................................... — 2,290.6 —
Other financing activities, net................................................................................... (28.5)(10.2) 8.7
Net cash provided (used) by financing activities ................................................. (216.5) 2,100.9 (38.9)
Effect of exchange rate changes on cash and cash equivalents.............................. (2.2)(3.0) 0.9
Net increase (decrease) in cash and cash equivalents........................................ (225.6)(281.0) 240.8
Cash and cash equivalents (a):
Beginning of period.............................................................................................. 343.0 554.8 206.3
End of period........................................................................................................ £ 117.4 £ 273.8 £ 447.1
Cash paid for interest ..................................................................................................... £ 222.3 £ 72.4 £ 102.9
Income taxes paid .......................................................................................................... £ 0.2 £ — £ 0.1
_______________
(a) The difference between the ending cash balance on June 7, 2013 and the beginning cash balance on June 8, 2013 of £107.7
million relates to cash balances of certain subsidiaries of Liberty Global that were contributed to or merged into our company
immediately following the LG/VM Transaction.