Virgin Media 2014 Annual Report Download - page 35
Download and view the complete annual report
Please find page 35 of the 2014 Virgin Media annual report below. You can navigate through the pages in the report by either clicking on the pages listed below, or by using the keyword search tool below to find specific information within the annual report.-
 1
1 -
2
-
3
-
4
-
5
-
6
-
7
-
8
-
9
-
10
-
11
-
12
-
13
-
14
-
15
-
16
-
17
-
18
-
19
-
20
-
21
-
22
-
23
-
24
-
 25
25 -
 26
26 -
 27
27 -
 28
28 -
 29
29 -
 30
30 -
 31
31 -
 32
32 -
 33
33 -
 34
34 -
 35
35 -
 36
36 -
 37
37 -
 38
38 -
 39
39 -
 40
40 -
 41
41 -
 42
42 -
 43
43 -
 44
44 -
 45
45 -
46
-
47
-
48
-
49
-
50
-
51
-
52
-
53
-
54
-
55
-
56
-
57
-
58
-
59
-
60
-
61
-
62
-
63
-
64
-
65
-
66
-
67
-
68
-
69
-
70
-
71
-
72
-
73
-
74
-
75
 |
 |

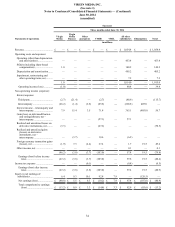
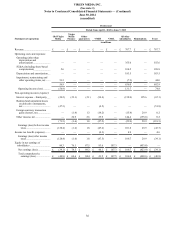
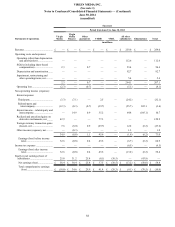
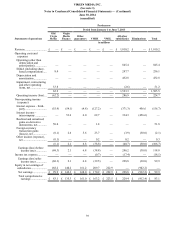
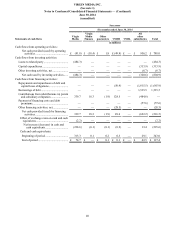
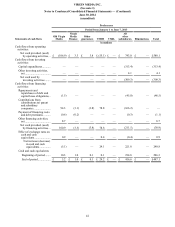
VIRGIN MEDIA INC.
(See note 1)
Notes to Condensed Consolidated Financial Statements — (Continued)
June 30, 2014
(unaudited)
33
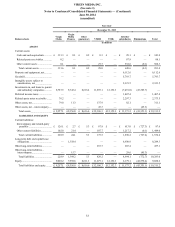
Successor
December 31, 2013
Balance sheets Virgin
Media
Virgin
Media
Finance Other
guarantors VMIH VMIL All other
subsidiaries Eliminations Total
in millions
ASSETS
Current assets:
Cash and cash equivalents............ £ 313.3 £ 0.1 £ 0.2 £ 0.3 £ — £ 29.1 £ — £ 343.0
Related-party receivables ............. 0.2 — — — — 87.9 — 88.1
Other current assets ...................... 0.1 — — 27.7 — 532.6 (0.1) 560.3
Total current assets..................... 313.6 0.1 0.2 28.0 — 649.6 (0.1) 991.4
Property and equipment, net............ — — — — — 6,112.6 — 6,112.6
Goodwill.......................................... — — — — — 5,793.7 — 5,793.7
Intangible assets subject to
amortization, net.......................... — — — — — 2,321.5 — 2,321.5
Investments in, and loans to, parent
and subsidiary companies............ 8,787.5 9,345.4 8,616.4 11,895.1 12,152.3 (7,491.0) (43,305.7) —
Deferred income taxes..................... — — — — — 1,407.4 — 1,407.4
Related-party notes receivable ........ 76.2 — — — — 2,297.3 — 2,373.5
Other assets, net............................... 79.8 11.3 — 137.9 — 82.1 — 311.1
Other assets, net – intercompany..... — — — 45.3 — — (45.3) —
Total assets................................. £ 9,257.1 £9,356.8 £ 8,616.6 £12,106.3 £12,152.3 £ 11,173.2 £ (43,351.1) £ 19,311.2
LIABILITIES AND EQUITY
Current liabilities:
Intercompany and related-party
payables .................................... £ 126.1 £ 2.7 £ 5.3 £ 67.8 £ — £ 613.0 £ (727.3) £ 87.6
Other current liabilities................. 102.8 21.4 — 107.7 — 1,217.2 (0.1) 1,449.0
Total current liabilities............... 228.9 24.1 5.3 175.5 — 1,830.2 (727.4) 1,536.6
Long-term debt and capital lease
obligations................................... — 1,358.4 — — — 6,930.9 — 8,289.3
Other long-term liabilities............... — — — 253.7 — 203.4 — 457.1
Other long-term liabilities –
intercompany............................... — 15.7 — — — 29.6 (45.3) —
Total liabilities ........................... 228.9 1,398.2 5.3 429.2 — 8,994.1 (772.7) 10,283.0
Equity .............................................. 9,028.2 7,958.6 8,611.3 11,677.1 12,152.3 2,179.1 (42,578.4) 9,028.2
Total liabilities and equity.......... £ 9,257.1 £9,356.8 £ 8,616.6 £12,106.3 £12,152.3 £ 11,173.2 £ (43,351.1) £ 19,311.2