Virgin Media 2014 Annual Report Download - page 70
Download and view the complete annual report
Please find page 70 of the 2014 Virgin Media annual report below. You can navigate through the pages in the report by either clicking on the pages listed below, or by using the keyword search tool below to find specific information within the annual report.-
 1
1 -
2
-
3
-
4
-
5
-
6
-
7
-
8
-
9
-
10
-
11
-
12
-
13
-
14
-
15
-
16
-
17
-
18
-
19
-
20
-
21
-
22
-
23
-
24
-
25
-
26
-
27
-
28
-
29
-
30
-
31
-
32
-
33
-
34
-
35
-
36
-
37
-
38
-
39
-
40
-
41
-
42
-
43
-
44
-
45
-
46
-
47
-
48
-
49
-
50
-
51
-
52
-
53
-
54
-
55
-
56
-
57
-
58
-
59
-
 60
60 -
 61
61 -
 62
62 -
 63
63 -
 64
64 -
 65
65 -
 66
66 -
 67
67 -
 68
68 -
 69
69 -
 70
70 -
 71
71 -
 72
72 -
 73
73 -
 74
74 -
 75
75
 |
 |

68
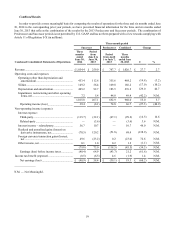
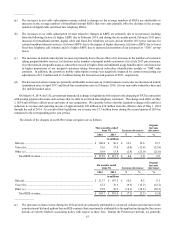
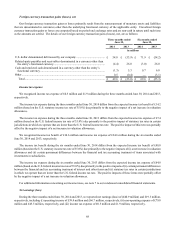
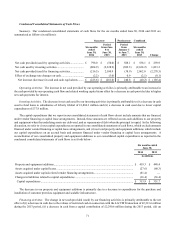
Foreign currency transaction gains (losses), net
Our foreign currency transaction gains or losses primarily result from the remeasurement of monetary assets and liabilities
that are denominated in currencies other than the underlying functional currency of the applicable entity. Unrealized foreign
currency transaction gains or losses are computed based on period-end exchange rates and are non-cash in nature until such time
as the amounts are settled. The details of our foreign currency transaction gains (losses), net, are as follows:
Three months ended
June 30, Six months ended
June 30,
2014 2013 2014 2013
in millions
U.S. dollar denominated debt issued by our company........................................ £ 54.8 £ (53.9) £ 71.9 £ (54.2)
Related-party payables and receivables denominated in a currency other than
the entity’s functional currency........................................................................ (4.4) 26.0 (3.0) 26.0
Cash and restricted cash denominated in a currency other than the entity’s
functional currency .......................................................................................... (1.3) 5.3 0.7 6.0
Other.................................................................................................................... 0.5 (0.4) — (3.1)
Total................................................................................................................ £ 49.6 £ (23.0) £ 69.6 £ (25.3)
Income tax expense
We recognized income tax expense of £0.5 million and £1.9 million during the three months ended June 30, 2014 and 2013,
respectively.
The income tax expense during the three months ended June 30, 2014 differs from the expected income tax benefit of £14.2
million (based on the U.S. statutory income tax rate of 35.0%) due primarily to the negative impact of a net increase in valuation
allowances.
The income tax expense during the three months ended June 30, 2013 differs from the expected income tax expense of £7.4
million (based on the U.S. federal income tax rate of 35.0%) due primarily to the positive impact of statutory tax rates in certain
jurisdictions in which we operate that are lower than the U.S. federal income tax rate. The positive impact of this item was partially
offset by the negative impact of a net increase in valuation allowances.
We recognized income tax benefit of £14.6 million and income tax expense of £24.6 million during the six months ended
June 30, 2014 and 2013, respectively.
The income tax benefit during the six months ended June 30, 2014 differs from the expected income tax benefit of £48.8
million (based on the U.S. statutory income tax rate of 35.0%) due primarily to the negative impacts of (i) a net increase in valuation
allowances and (ii) certain permanent differences between the financial and tax accounting treatment of items associated with
investments in subsidiaries.
The income tax expense during the six months ended June 30, 2013 differs from the expected income tax expense of £64.0
million (based on the U.S. federal income tax rate of 35.0%) due primarily to the positive impacts of (i) certain permanent differences
between the financial and tax accounting treatment of interest and other items and (ii) statutory tax rates in certain jurisdictions
in which we operate that are lower than the U.S. federal income tax rate. The positive impacts of these items were partially offset
by the negative impact of a net increase in valuation allowances.
For additional information concerning our income taxes, see note 7 to our condensed consolidated financial statements.
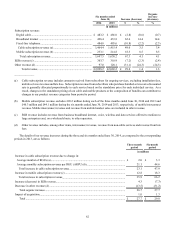
Net earnings (loss)
During the three months ended June 30, 2014 and 2013, we reported net earnings (loss) of (£40.9 million) and £19.3 million,
respectively, including (i) operating income of £39.4 million and £66.7 million, respectively, (ii) non-operating expense of £79.8
million and £45.5 million, respectively, and (iii) income tax expense of £0.5 million and £1.9 million, respectively.