Virgin Media 2014 Annual Report Download - page 61
Download and view the complete annual report
Please find page 61 of the 2014 Virgin Media annual report below. You can navigate through the pages in the report by either clicking on the pages listed below, or by using the keyword search tool below to find specific information within the annual report.-
 1
1 -
2
-
3
-
4
-
5
-
6
-
7
-
8
-
9
-
10
-
11
-
12
-
13
-
14
-
15
-
16
-
17
-
18
-
19
-
20
-
21
-
22
-
23
-
24
-
25
-
26
-
27
-
28
-
29
-
30
-
31
-
32
-
33
-
34
-
35
-
36
-
37
-
38
-
39
-
40
-
41
-
42
-
43
-
44
-
45
-
46
-
47
-
48
-
49
-
50
-
 51
51 -
 52
52 -
 53
53 -
 54
54 -
 55
55 -
 56
56 -
 57
57 -
 58
58 -
 59
59 -
 60
60 -
 61
61 -
 62
62 -
 63
63 -
 64
64 -
 65
65 -
 66
66 -
 67
67 -
 68
68 -
 69
69 -
 70
70 -
 71
71 -
72
-
73
-
74
-
75
 |
 |

59
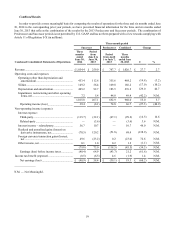
Combined Results
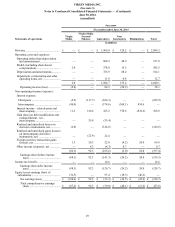
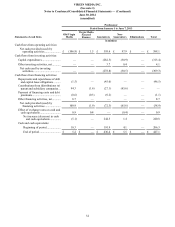
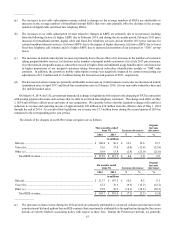
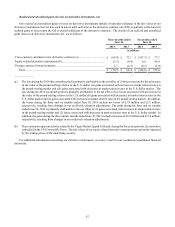
In order to provide a more meaningful basis for comparing the results of operations for the three and six months ended June
30, 2014 to the corresponding prior year periods, we have presented financial information for the three and six months ended
June 30, 2013 that reflects the combination of the results for the 2013 Predecessor and Successor periods. The combination of
Predecessor and Successor periods is not permitted by U.S. GAAP and has not been prepared with a view towards complying with
Article 11 of Regulation S-X (in millions):
Three-month period
Successor Predecessor Combined Change
Condensed Consolidated Statements of Operations
Three
months
ended
June 30,
2014
Period
from
June 8 to
June 30,
2013
Period
from April
1 to June 7,
2013
Three
months
ended June
30, 2013 £ %
Revenue................................................................... £1,054.4 £ 259.0 £ 767.7 £ 1,026.7 £ 27.7 2.7
Operating costs and expenses:
Operating (other than depreciation and
amortization)................................................... 453.4 112.6 355.6 468.2 (14.8)(3.2)
SG&A................................................................. 149.2 56.4 109.8 166.2 (17.0)(10.2)
Depreciation and amortization ........................... 405.2 92.7 183.5 276.2 129.0 46.7
Impairment, restructuring and other operating
items, net......................................................... 7.2 5.4 44.0 49.4 (42.2) N.M.
1,015.0 267.1 692.9 960.0 55.0 5.7
Operating income (loss)................................... 39.4 (8.1) 74.8 66.7 (27.3)(40.9)
Non-operating income (expense):
Interest expense:
Third-party....................................................... (115.7) (32.1)(67.1)(99.2)(16.5) 16.6
Related-party.................................................... —(3.6) — (3.6)3.6 N.M.
Interest income – related-party........................... 56.7 10.7 — 10.7 46.0 N.M.
Realized and unrealized gains (losses) on
derivative instruments, net.............................. (70.5) 120.2 (51.8) 68.4 (138.9) N.M.
Foreign currency transaction gains (losses),
net ................................................................... 49.6 (23.2) 0.2 (23.0) 72.6 N.M.
Other income, net............................................... 0.1 1.0 0.2 1.2 (1.1) N.M.
(79.8) 73.0 (118.5)(45.5)(34.3) N.M.
Earnings (loss) before income taxes ................ (40.4) 64.9 (43.7) 21.2 (61.6) N.M.
Income tax benefit (expense) .................................. (0.5) (6.5) 4.6 (1.9) 1.4 N.M.
Net earnings (loss) ........................................... £ (40.9) £ 58.4 £ (39.1) £ 19.3 £ (60.2) N.M.
_______________
N.M. — Not Meaningful.