Virgin Media 2014 Annual Report Download - page 64
Download and view the complete annual report
Please find page 64 of the 2014 Virgin Media annual report below. You can navigate through the pages in the report by either clicking on the pages listed below, or by using the keyword search tool below to find specific information within the annual report.-
 1
1 -
2
-
3
-
4
-
5
-
6
-
7
-
8
-
9
-
10
-
11
-
12
-
13
-
14
-
15
-
16
-
17
-
18
-
19
-
20
-
21
-
22
-
23
-
24
-
25
-
26
-
27
-
28
-
29
-
30
-
31
-
32
-
33
-
34
-
35
-
36
-
37
-
38
-
39
-
40
-
41
-
42
-
43
-
44
-
45
-
46
-
47
-
48
-
49
-
50
-
51
-
52
-
53
-
 54
54 -
 55
55 -
 56
56 -
 57
57 -
 58
58 -
 59
59 -
 60
60 -
 61
61 -
 62
62 -
 63
63 -
 64
64 -
 65
65 -
 66
66 -
 67
67 -
 68
68 -
 69
69 -
 70
70 -
 71
71 -
 72
72 -
 73
73 -
 74
74 -
75
 |
 |

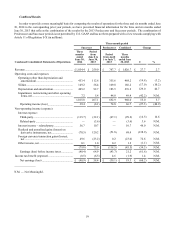
62
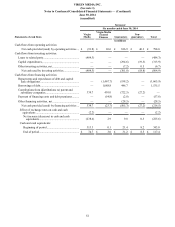
Six months ended
June 30, Increase (decrease)
Organic
increase
(decrease)
2014 2013 £ % %
in millions
Subscription revenue:
Digital cable..................................................................................... £ 483.2 £ 486.0 £ (2.8)(0.6)(0.7)
Broadband internet .......................................................................... 496.4 433.8 62.6 14.4 14.4
Fixed-line telephony........................................................................ 484.8 495.6 (10.8)(2.2)(2.3)
Cable subscription revenue (a)...................................................... 1,464.4 1,415.4 49.0 3.5 3.4
Mobile subscription revenue (b)...................................................... 233.1 214.8 18.3 8.5 8.5
Total subscription revenue.......................................................... 1,697.5 1,630.2 67.3 4.1 4.1
B2B revenue (c)................................................................................. 303.7 310.9 (7.2)(2.3)(2.4)
Other revenue (d)............................................................................... 97.0 128.1 (31.1)(24.3)(24.3)
Total revenue............................................................................ £2,098.2 £2,069.2 £ 29.0 1.4 1.3
______________
(a) Cable subscription revenue includes amounts received from subscribers for ongoing services, excluding installation fees,
mobile services revenue and late fees. Subscription revenue from subscribers who purchase bundled services at a discounted
rate is generally allocated proportionally to each service based on the standalone price for each individual service. As a
result, changes in the standalone pricing of our cable and mobile products or the composition of bundles can contribute to
changes in our product revenue categories from period to period.
(b) Mobile subscription revenue excludes £20.2 million during each of the three months ended June 30, 2014 and 2013 and
£40.3 million and £44.1 million during the six months ended June 30, 2014 and 2013, respectively, of mobile interconnect
revenue. Mobile interconnect revenue and revenue from mobile handset sales are included in other revenue.
(c) B2B revenue includes revenue from business broadband internet, voice, wireless and data services offered to medium to
large enterprises and, on a wholesale basis, to other operators.
(d) Other revenue includes, among other items, interconnect revenue, revenue from non-cable services and revenue from late
fees.
The details of our revenue increases during the three and six months ended June 30, 2014, as compared to the corresponding
periods in 2013, are as follows:
Three-month
period Six-month
period
in millions
Increase in cable subscription revenue due to change in:
Average number of RGUs (a)........................................................................................................ £ 2.0 £ 3.3
Average monthly subscription revenue per RGU (ARPU) (b)...................................................... 21.1 44.6
Total increase in cable subscription revenue.............................................................................. 23.1 47.9
Increase in mobile subscription revenue (c) .................................................................................... 12.8 18.3
Total increase in subscription revenue........................................................................................ 35.9 66.2
Increase (decrease) in B2B revenue................................................................................................. 4.3 (7.3)
Decrease in other revenue (d) .......................................................................................................... (13.5)(31.2)
Total organic increase................................................................................................................ 26.7 27.7
Impact of acquisition........................................................................................................................ 1.0 1.3
Total........................................................................................................................................... £ 27.7 £ 29.0