Virgin Media 2014 Annual Report Download - page 65
Download and view the complete annual report
Please find page 65 of the 2014 Virgin Media annual report below. You can navigate through the pages in the report by either clicking on the pages listed below, or by using the keyword search tool below to find specific information within the annual report.-
 1
1 -
2
-
3
-
4
-
5
-
6
-
7
-
8
-
9
-
10
-
11
-
12
-
13
-
14
-
15
-
16
-
17
-
18
-
19
-
20
-
21
-
22
-
23
-
24
-
25
-
26
-
27
-
28
-
29
-
30
-
31
-
32
-
33
-
34
-
35
-
36
-
37
-
38
-
39
-
40
-
41
-
42
-
43
-
44
-
45
-
46
-
47
-
48
-
49
-
50
-
51
-
52
-
53
-
54
-
 55
55 -
 56
56 -
 57
57 -
 58
58 -
 59
59 -
 60
60 -
 61
61 -
 62
62 -
 63
63 -
 64
64 -
 65
65 -
 66
66 -
 67
67 -
 68
68 -
 69
69 -
 70
70 -
 71
71 -
 72
72 -
 73
73 -
 74
74 -
 75
75
 |
 |

63
______________
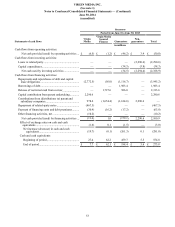
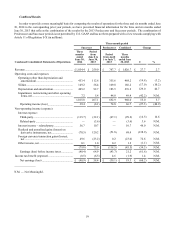
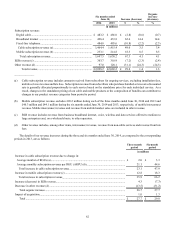
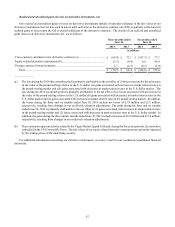
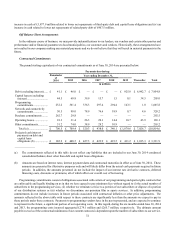
(a) The increases in our cable subscription revenue related to changes in the average numbers of RGUs are attributable to
increases in the average numbers of broadband internet RGUs that were only partially offset by declines in the average
numbers of digital cable and fixed-line telephony RGUs.
(b) The increases in our cable subscription revenue related to changes in ARPU are primarily due to net increases resulting
from the following factors: (i) higher ARPU due to February 2014, and during the six-month period, February 2013 price
increases for broadband internet, digital cable and fixed-line telephony services and an October 2013 price increase for
certain broadband internet services, (ii) lower ARPU due to the impact of higher discounts, (iii) lower ARPU due to lower
fixed-line telephony call volumes and (iv) higher ARPU due to increased penetration of our advanced or “TiVo” set-top
boxes.
(c) The increases in mobile subscription revenue are primarily due to the net effect of (i) increases in the numbers of customers
taking postpaid mobile services, (ii) declines in the numbers of prepaid mobile customers, (iii) a July 2013 price increase,
(iv) reductions in chargeable usage as subscribers moved to higher-limit and unlimited usage bundles and (v) decreases due
to higher proportions of our postpaid customers taking lower-priced subscriber identification module or “SIM”-only
contracts. In addition, the growth in mobile subscription revenue was negatively impacted by certain nonrecurring net
adjustments of £3.9 million and £1.2 million during the first and second quarters of 2013, respectively.
(d) The decreases in other revenue are primarily attributable to decreases in (i) interconnect revenue due to reductions in mobile
termination rates in April 2013 and fixed-line termination rates in February 2014, (ii) our non-cable subscriber base and
(iii) mobile handset sales.
On March 19, 2014, the U.K. government announced a change in legislation with respect to the charging of VAT in connection
with prompt payment discounts such as those that we offer to our fixed-line telephony customers. The change took effect on May
1, 2014 and will have effects on us and some of our competitors. We currently believe that this legislative change will result in a
reduction in revenue and operating income of approximately £28 million to £30 million from the effective date of May 1, 2014
through the end of 2014. As a result of this legislation, our revenue was £7.3 million lower during the second quarter of 2014 as
compared to the corresponding prior year period.
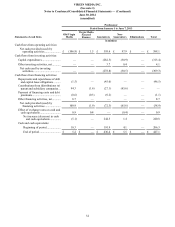
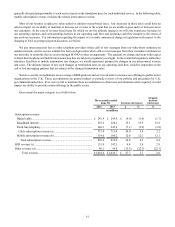
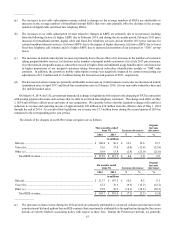
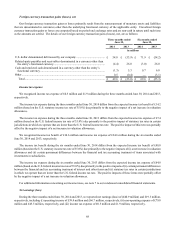
The details of the changes in our B2B revenue categories are as follows:
Three months ended
June 30, Increase (decrease)
Organic
increase
(decrease)
2014 2013 £% %
in millions
Data (a)................................................................................................ £ 108.4 £ 96.3 £ 12.1 12.6 12.5
Voice (b).............................................................................................. 32.6 37.4 (4.8)(12.8)(12.8)
Other (c).............................................................................................. 10.9 13.8 (2.9)(21.0)(21.0)
Total B2B revenue.......................................................................... £ 151.9 £ 147.5 £ 4.4 3.0 2.9
Six months ended
June 30, Increase (decrease)
Organic
increase
(decrease)
2014 2013 £% %
in millions
Data (a)................................................................................................ £ 213.7 £ 197.5 £ 16.2 8.2 8.1
Voice (b).............................................................................................. 67.2 76.5 (9.3)(12.2)(12.2)
Other (c).............................................................................................. 22.8 36.9 (14.1)(38.2)(38.2)
Total B2B revenue.......................................................................... £ 303.7 £ 310.9 £ (7.2)(2.3)(2.4)
______________
(a) The increases in data revenue during the 2014 periods are primarily attributable to increased volumes and increases in the
amortization of deferred upfront fees on B2B contracts that are primarily attributable to the application during the Successor
periods of Liberty Global’s accounting policy with respect to these fees. During the Predecessor periods, we generally