Virgin Media 2014 Annual Report Download - page 74
Download and view the complete annual report
Please find page 74 of the 2014 Virgin Media annual report below. You can navigate through the pages in the report by either clicking on the pages listed below, or by using the keyword search tool below to find specific information within the annual report.-
 1
1 -
2
-
3
-
4
-
5
-
6
-
7
-
8
-
9
-
10
-
11
-
12
-
13
-
14
-
15
-
16
-
17
-
18
-
19
-
20
-
21
-
22
-
23
-
24
-
25
-
26
-
27
-
28
-
29
-
30
-
31
-
32
-
33
-
34
-
35
-
36
-
37
-
38
-
39
-
40
-
41
-
42
-
43
-
44
-
45
-
46
-
47
-
48
-
49
-
50
-
51
-
52
-
53
-
54
-
55
-
56
-
57
-
58
-
59
-
60
-
61
-
62
-
63
-
 64
64 -
 65
65 -
 66
66 -
 67
67 -
 68
68 -
 69
69 -
 70
70 -
 71
71 -
 72
72 -
 73
73 -
 74
74 -
 75
75
 |
 |

72
increase in cash of £1,877.9 million related to lower net repayments of third-party debt and capital lease obligations and (iv) an
increase in cash related to lower net repayments of related-party debt of £467.5 million.
Off Balance Sheet Arrangements
In the ordinary course of business, we may provide indemnifications to our lenders, our vendors and certain other parties and
performance and/or financial guarantees to local municipalities, our customers and vendors. Historically, these arrangements have
not resulted in our company making any material payments and we do not believe that they will result in material payments in the
future.
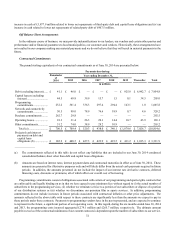
Contractual Commitments
The pound sterling equivalents of our contractual commitments as of June 30, 2014 are presented below:
Payments due during:
Remainder
of
2014
Year ending December 31,
2015 2016 2017 2018 2019 Thereafter Total
in millions
Debt (excluding interest)...... £ 41.1 £ 46.0 £ — £ — £ — £ 925.0 £ 6,942.7 £ 7,954.8
Capital leases (excluding
interest)............................. 44.5 68.8 39.9 15.7 1.5 0.1 34.5 205.0
Programming
commitments.................... 232.2 361.4 336.3 297.4 294.4 143.1 1.0 1,665.8
Network and connectivity
commitments.................... 50.5 98.0 78.9 76.6 18.9 0.7 4.6 328.2
Purchase commitments ........ 262.7 29.8 — — — — — 292.5
Operating leases................... 18.3 31.4 26.3 20.1 14.4 10.7 43.9 165.1
Other commitments.............. 51.2 74.0 38.9 28.2 10.9 — — 203.2
Total (a)........................... £ 700.5 £ 709.4 £ 520.3 £ 438.0 £ 340.1 £ 1,079.6 £ 7,026.7 £10,814.6
Projected cash interest
payments on debt and
capital lease
obligations (b) .................. £ 182.2 £ 448.5 £ 427.3 £ 423.9 £ 423.5 £ 411.2 £ 1,015.3 £ 3,331.9
______________
(a) The commitments reflected in this table do not reflect any liabilities that are included in our June 30, 2014 condensed
consolidated balance sheet other than debt and capital lease obligations.
(b) Amounts are based on interest rates, interest payment dates and contractual maturities in effect as of June 30, 2014. These
amounts are presented for illustrative purposes only and will likely differ from the actual cash payments required in future
periods. In addition, the amounts presented do not include the impact of our interest rate derivative contracts, deferred
financing costs, discounts or premiums, all of which affect our overall cost of borrowing.
Programming commitments consist of obligations associated with certain of our programming and sports rights contracts that
are enforceable and legally binding on us in that we have agreed to pay minimum fees without regard to (i) the actual number of
subscribers to the programming services, (ii) whether we terminate service to a portion of our subscribers or dispose of a portion
of our distribution systems or (iii) whether we discontinue our premium film or sports services. In addition, programming
commitments do not include increases in future periods associated with contractual inflation or other price adjustments. The
amounts reflected in the above table with respect to these contracts are significantly less than the amounts we expect to pay in
these periods under these contracts. Payments to programming vendors have in the past represented, and are expected to continue
to represent in the future, a significant portion of our operating costs. In this regard, during the six months ended June 30, 2014
and 2013, the programming costs incurred aggregated £279.1 million and £265.7 million, respectively. The ultimate amount
payable in excess of the contractual minimums of our content contracts is dependent upon the number of subscribers to our service.