Virgin Media 2014 Annual Report Download - page 50
Download and view the complete annual report
Please find page 50 of the 2014 Virgin Media annual report below. You can navigate through the pages in the report by either clicking on the pages listed below, or by using the keyword search tool below to find specific information within the annual report.-
 1
1 -
2
-
3
-
4
-
5
-
6
-
7
-
8
-
9
-
10
-
11
-
12
-
13
-
14
-
15
-
16
-
17
-
18
-
19
-
20
-
21
-
22
-
23
-
24
-
25
-
26
-
27
-
28
-
29
-
30
-
31
-
32
-
33
-
34
-
35
-
36
-
37
-
38
-
39
-
 40
40 -
 41
41 -
 42
42 -
 43
43 -
 44
44 -
 45
45 -
 46
46 -
 47
47 -
 48
48 -
 49
49 -
 50
50 -
 51
51 -
 52
52 -
 53
53 -
 54
54 -
 55
55 -
 56
56 -
 57
57 -
 58
58 -
 59
59 -
 60
60 -
61
-
62
-
63
-
64
-
65
-
66
-
67
-
68
-
69
-
70
-
71
-
72
-
73
-
74
-
75
 |
 |

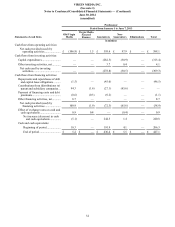
VIRGIN MEDIA INC.
(See note 1)
Notes to Condensed Consolidated Financial Statements — (Continued)
June 30, 2014
(unaudited)
48
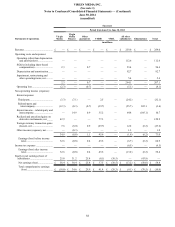
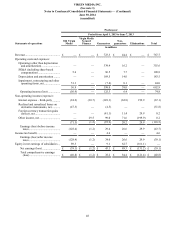
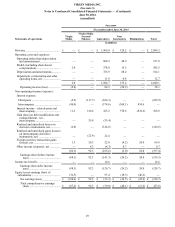
Predecessor
Period from April 1, 2013 to June 7, 2013
Statements of operations Old Virgin
Media
Virgin Media
Secured
Finance Guarantors Non-
guarantors Eliminations Total
in millions
Revenue................................................. £ — £ — £ 723.3 £ 44.4 £ — £ 767.7
Operating costs and expenses:
Operating (other than depreciation
and amortization).......................... — — 339.4 16.2 — 355.6
SG&A (including share-based
compensation)............................... 5.6 — 96.5 7.7 — 109.8
Depreciation and amortization ......... — — 169.5 14.0 — 183.5
Impairment, restructuring and other
operating items, net....................... 51.3 — (7.4) 0.1 — 44.0
56.9 — 598.0 38.0 — 692.9
Operating income (loss)................. (56.9) — 125.3 6.4 — 74.8
Non-operating income (expense):
Interest expense – third-party........... (24.2) (30.7)(149.3)(62.8) 199.9 (67.1)
Realized and unrealized losses on
derivative instruments, net............ (47.3) — (4.5) — — (51.8)
Foreign currency transaction gains
(losses), net ................................... — — (41.1) 11.4 29.9 0.2
Other income, net............................. — 29.5 99.0 71.6 (199.9) 0.2
(71.5) (1.2)(95.9) 20.2 29.9 (118.5)
Earnings (loss) before income
taxes............................................ (128.4) (1.2) 29.4 26.6 29.9 (43.7)
Income tax benefit................................. — — 4.6 — — 4.6
Earnings (loss) after income
taxes............................................ (128.4) (1.2) 34.0 26.6 29.9 (39.1)
Equity in net earnings of subsidiaries ... 89.3 — 9.1 62.7 (161.1) —
Net earnings (loss) ......................... £ (39.1) £ (1.2) £ 43.1 £ 89.3 £ (131.2) £ (39.1)
Total comprehensive earnings
(loss)........................................... £ (40.8) £ (1.2) £ 38.2 £ 84.4 £ (121.4) £ (40.8)