Virgin Media 2014 Annual Report Download - page 62
Download and view the complete annual report
Please find page 62 of the 2014 Virgin Media annual report below. You can navigate through the pages in the report by either clicking on the pages listed below, or by using the keyword search tool below to find specific information within the annual report.-
 1
1 -
2
-
3
-
4
-
5
-
6
-
7
-
8
-
9
-
10
-
11
-
12
-
13
-
14
-
15
-
16
-
17
-
18
-
19
-
20
-
21
-
22
-
23
-
24
-
25
-
26
-
27
-
28
-
29
-
30
-
31
-
32
-
33
-
34
-
35
-
36
-
37
-
38
-
39
-
40
-
41
-
42
-
43
-
44
-
45
-
46
-
47
-
48
-
49
-
50
-
51
-
 52
52 -
 53
53 -
 54
54 -
 55
55 -
 56
56 -
 57
57 -
 58
58 -
 59
59 -
 60
60 -
 61
61 -
 62
62 -
 63
63 -
 64
64 -
 65
65 -
 66
66 -
 67
67 -
 68
68 -
 69
69 -
 70
70 -
 71
71 -
 72
72 -
73
-
74
-
75
 |
 |

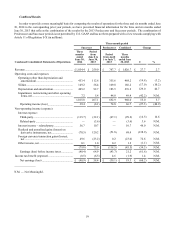
60
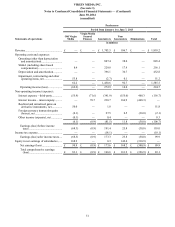
Six-month period
Successor Predecessor Combined Change
Consolidated Statements of Operations
Six months
ended
June 30,
2014
Period
from
June 8 to
June 30,
2013
Period from
January 1
to June 7,
2013
Six months
ended
June 30,
2013 £ %
Revenue................................................................ £ 2,098.2 £ 259.0 £ 1,810.2 £ 2,069.2 £ 29.0 1.4
Operating costs and expenses:
Operating (other than depreciation and
amortization)................................................ 917.8 112.6 845.4 958.0 (40.2)(4.2)
SG&A.............................................................. 295.5 56.4 256.1 312.5 (17.0)(5.4)
Depreciation and amortization........................ 814.1 92.7 432.8 525.5 288.6 54.9
Impairment, restructuring and other operating
items, net...................................................... 12.7 5.4 51.2 56.6 (43.9) N.M.
2,040.1 267.1 1,585.5 1,852.6 187.5 10.1
Operating income (loss)................................ 58.1 (8.1) 224.7 216.6 (158.5)(73.2)
Non-operating income (expense):
Interest expense:
Third-party.................................................... (229.9) (32.1)(156.7)(188.8)(41.1) 21.8
Related-party................................................. —(3.6) — (3.6) 3.6 N.M.
Interest income – related-party........................ 108.8 10.7 — 10.7 98.1 N.M.
Realized and unrealized gains (losses) on
derivative instruments, net........................... (146.6) 120.2 51.8 172.0 (318.6) N.M.
Foreign currency transaction gains (losses),
net ................................................................ 69.6 (23.2)(2.1)(25.3) 94.9 N.M.
Other income, net............................................ 0.7 1.0 0.3 1.3 (0.6) N.M.
(197.4) 73.0 (106.7)(33.7)(163.7) N.M.
Earnings (loss) before income taxes............. (139.3) 64.9 118.0 182.9 (322.2) N.M.
Income tax benefit (expense)............................... 14.6 (6.5)(18.1)(24.6) 39.2 N.M.
Net earnings (loss)........................................ £ (124.7) £ 58.4 £ 99.9 £ 158.3 £ (283.0) N.M.
_______________
N.M. — Not Meaningful.
Material Changes in Results of Operations
As noted under Overview above, the comparability of our operating results during 2014 and 2013 is affected by an acquisition.
In the following discussion, we quantify the estimated impact of the acquisition on our operating results. The acquisition impact
represents our estimate of the difference between the operating results of the periods under comparison that is attributable to an
acquisition. In general, we base our estimate of the acquisition impact on an acquired entity’s operating results during the first
three months following the acquisition date such that changes from those operating results in subsequent periods are considered
to be organic changes. Accordingly, in the following discussion, variances attributed to an acquired entity during the first twelve
months following the acquisition date represent differences between the estimated acquisition impact and the actual results. This
section provides an analysis of our results of operations for the three and six months ended June 30, 2014 and 2013.
Discussion and Analysis
Revenue
Revenue includes amounts received from residential subscribers for ongoing services as well as revenue earned from B2B
services, interconnect fees and other categories of non-subscription revenue. We use the term “subscription revenue” in the
following discussion to refer to amounts received from cable and mobile residential subscribers for ongoing services, excluding
installation fees and late fees. Subscription revenue from subscribers who purchase bundled services at a discounted rate is