Virgin Media 2014 Annual Report Download - page 63
Download and view the complete annual report
Please find page 63 of the 2014 Virgin Media annual report below. You can navigate through the pages in the report by either clicking on the pages listed below, or by using the keyword search tool below to find specific information within the annual report.-
 1
1 -
2
-
3
-
4
-
5
-
6
-
7
-
8
-
9
-
10
-
11
-
12
-
13
-
14
-
15
-
16
-
17
-
18
-
19
-
20
-
21
-
22
-
23
-
24
-
25
-
26
-
27
-
28
-
29
-
30
-
31
-
32
-
33
-
34
-
35
-
36
-
37
-
38
-
39
-
40
-
41
-
42
-
43
-
44
-
45
-
46
-
47
-
48
-
49
-
50
-
51
-
52
-
 53
53 -
 54
54 -
 55
55 -
 56
56 -
 57
57 -
 58
58 -
 59
59 -
 60
60 -
 61
61 -
 62
62 -
 63
63 -
 64
64 -
 65
65 -
 66
66 -
 67
67 -
 68
68 -
 69
69 -
 70
70 -
 71
71 -
 72
72 -
 73
73 -
74
-
75
 |
 |

61
generally allocated proportionally to each service based on the standalone price for each individual service. In the following table,
mobile subscription revenue excludes the related interconnect revenue.
Most of our revenue is subject to value-added or similar revenue-based taxes. Any increases in these taxes could have an
adverse impact on our ability to maintain or increase our revenue to the extent that we are unable to pass such tax increases on to
our customers. In the case of revenue-based taxes for which we are the ultimate taxpayer, we will also experience increases in
our operating expenses and corresponding declines in our operating cash flow and operating cash flow margins to the extent of
any such tax increases. For information regarding the impact of a recently announced change in legislation with respect to the
charging of VAT on prompt payment discounts, see below.
We pay interconnection fees to other telephony providers when calls or text messages from our subscribers terminate on
another network, and we receive similar fees from such providers when calls or text messages from their customers terminate on
our networks or networks that we access through MVNO or other arrangements. The amounts we charge and incur with respect
to fixed-line telephony and mobile interconnection fees are subject to regulatory oversight. To the extent that regulatory authorities
introduce fixed-line or mobile termination rate changes, we would experience prospective changes in our interconnect revenue
and costs. The ultimate impact of any such changes in termination rates on our operating cash flow would be dependent on the
call or text messaging patterns that are subject to the changed termination rates.
We have security accreditations across a range of B2B products and services in order to increase our offerings to public sector
organizations in the U.K. These accreditations are granted subject to periodic reviews of our policies and procedures by U.K.
governmental authorities. If we were to fail to maintain these accreditations or obtain new accreditations when required, it could
impact our ability to provide certain offerings to the public sector.
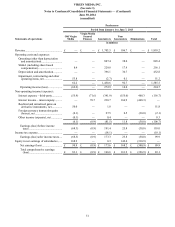
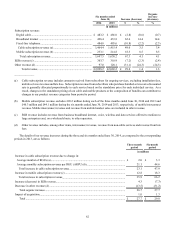
Our revenue by major category is set forth below:
Three months ended
June 30, Increase (decrease)
Organic
increase
(decrease)
2014 2013 £ % %
in millions
Subscription revenue:
Digital cable..................................................................................... £ 241.9 £ 245.9 £ (4.0)(1.6)(1.7)
Broadband internet .......................................................................... 255.2 220.1 35.1 15.9 15.8
Fixed-line telephony........................................................................ 240.3 247.4 (7.1)(2.9)(3.0)
Cable subscription revenue (a)...................................................... 737.4 713.4 24.0 3.4 3.2
Mobile subscription revenue (b)...................................................... 119.0 106.2 12.8 12.1 12.1
Total subscription revenue.......................................................... 856.4 819.6 36.8 4.5 4.4
B2B revenue (c)................................................................................. 151.9 147.5 4.4 3.0 2.9
Other revenue (d)............................................................................... 46.1 59.6 (13.5)(22.7)(22.7)
Total revenue............................................................................ £1,054.4 £1,026.7 £ 27.7 2.7 2.6