Virgin Media 2014 Annual Report Download - page 17
Download and view the complete annual report
Please find page 17 of the 2014 Virgin Media annual report below. You can navigate through the pages in the report by either clicking on the pages listed below, or by using the keyword search tool below to find specific information within the annual report.-
 1
1 -
2
-
3
-
4
-
5
-
6
-
 7
7 -
 8
8 -
 9
9 -
 10
10 -
 11
11 -
 12
12 -
 13
13 -
 14
14 -
 15
15 -
 16
16 -
 17
17 -
 18
18 -
 19
19 -
 20
20 -
 21
21 -
 22
22 -
 23
23 -
 24
24 -
 25
25 -
 26
26 -
 27
27 -
28
-
29
-
30
-
31
-
32
-
33
-
34
-
35
-
36
-
37
-
38
-
39
-
40
-
41
-
42
-
43
-
44
-
45
-
46
-
47
-
48
-
49
-
50
-
51
-
52
-
53
-
54
-
55
-
56
-
57
-
58
-
59
-
60
-
61
-
62
-
63
-
64
-
65
-
66
-
67
-
68
-
69
-
70
-
71
-
72
-
73
-
74
-
75
 |
 |

VIRGIN MEDIA INC.
(See note 1)
Notes to Condensed Consolidated Financial Statements — (Continued)
June 30, 2014
(unaudited)
15
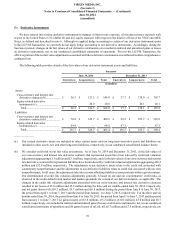
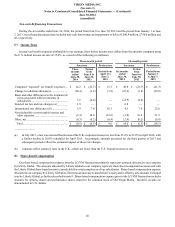
Successor
Fair value measurements at
December 31, 2013 using:
Description December 31,
2013
Quoted prices
in active
markets for
identical assets
(Level 1)
Significant
other
observable
inputs
(Level 2)
Significant
unobservable
inputs
(Level 3)
in millions
Assets:
Cross-currency and interest rate derivative contracts ......... £ 165.7 £ — £ 165.7 £ —
Equity-related derivative instruments................................. 20.1 — — 20.1
Total assets........................................................................ £ 185.8 £ — £ 165.7 £ 20.1
Liabilities:
Cross-currency and interest rate derivative contracts ......... £ 322.9 £ — £ 322.9 £ —
Equity-related derivative instruments................................. 67.3 — — 67.3
Total liabilities.................................................................. £ 390.2 £ — £ 322.9 £ 67.3
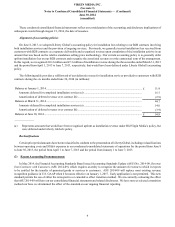
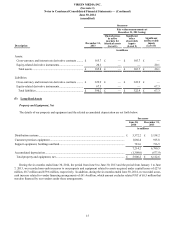
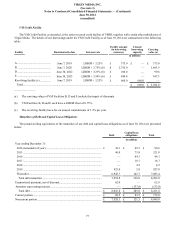
(5) Long-lived Assets
Property and Equipment, Net
The details of our property and equipment and the related accumulated depreciation are set forth below:
Successor
June 30,
2014 December 31,
2013
in millions
Distribution systems........................................................................................................................ £ 5,372.2 £ 5,158.2
Customer premises equipment ........................................................................................................ 1,060.4 915.8
Support equipment, buildings and land........................................................................................... 781.6 716.5
7,214.2 6,790.5
Accumulated depreciation............................................................................................................... (1,308.0)(677.9)
Total property and equipment, net................................................................................................ £ 5,906.2 £ 6,112.6
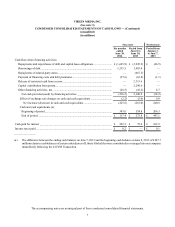
During the six months ended June 30, 2014, the period from June 8 to June 30, 2013 and the period from January 1 to June
7, 2013, we recorded non-cash increases to our property and equipment related to assets acquired under capital leases of £27.6
million, £0.7 million and £59.6 million, respectively. In addition, during the six months ended June 30, 2014, we recorded a non-
cash increase related to vendor financing arrangements of £61.4 million, which amount excludes related VAT of £6.5 million that
was also financed by our vendors under these arrangements.