Virgin Media 2014 Annual Report Download - page 13
Download and view the complete annual report
Please find page 13 of the 2014 Virgin Media annual report below. You can navigate through the pages in the report by either clicking on the pages listed below, or by using the keyword search tool below to find specific information within the annual report.-
 1
1 -
2
-
 3
3 -
 4
4 -
 5
5 -
 6
6 -
 7
7 -
 8
8 -
 9
9 -
 10
10 -
 11
11 -
 12
12 -
 13
13 -
 14
14 -
 15
15 -
 16
16 -
 17
17 -
 18
18 -
 19
19 -
 20
20 -
 21
21 -
 22
22 -
 23
23 -
24
-
25
-
26
-
27
-
28
-
29
-
30
-
31
-
32
-
33
-
34
-
35
-
36
-
37
-
38
-
39
-
40
-
41
-
42
-
43
-
44
-
45
-
46
-
47
-
48
-
49
-
50
-
51
-
52
-
53
-
54
-
55
-
56
-
57
-
58
-
59
-
60
-
61
-
62
-
63
-
64
-
65
-
66
-
67
-
68
-
69
-
70
-
71
-
72
-
73
-
74
-
75
 |
 |

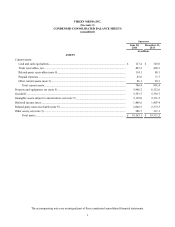
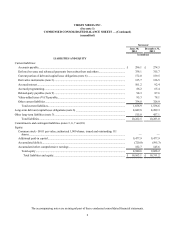
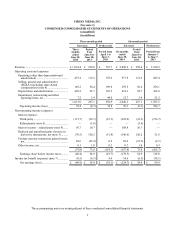
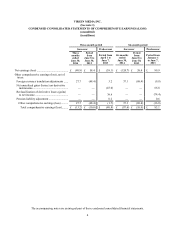
VIRGIN MEDIA INC.
(See note 1)
Notes to Condensed Consolidated Financial Statements — (Continued)
June 30, 2014
(unaudited)
11
included in net unrealized gains (losses) on derivative instruments in our condensed consolidated statements of
comprehensive earnings (loss). For further information concerning our fair value measurements, see note 4.
(c) The fair value of our (i) equity-related derivative assets relate to the Virgin Media Capped Calls, as defined and described
below, and (ii) equity-related derivative liabilities relate to the derivative embedded in the VM Convertible Notes, as defined
and described in note 6.
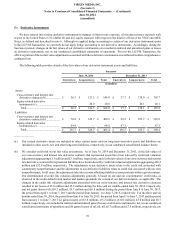
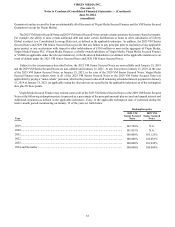
The details of our realized and unrealized gains (losses) on derivative instruments, net, are as follows (in millions):
Three-month period Six-month period
Successor Predecessor
(a) Successor Predecessor
(a)
Three
months
ended
June 30,
2014
Period
from
June 8 to
June 30,
2013
Period from
April 1 to
June 7,
2013
Six months
ended
June 30,
2014
Period
from
June 8 to
June 30,
2013
Period from
January 1
to June 7,
2013
Cross-currency and interest rate derivative
contracts........................................................ £ (69.9) £ 77.4 £ (4.3) £ (147.3) £ 77.4 £ (0.3)
Equity-related derivative instruments (b)......... (3.3) 46.9 (47.3) 0.8 46.9 50.0
Foreign currency forward contracts (c)............ 2.7 (4.1)(0.2)(0.1)(4.1) 2.1
Total............................................................. £ (70.5) £ 120.2 £ (51.8) £ (146.6) £ 120.2 £ 51.8
______________
(a) The Predecessor periods include net hedge ineffectiveness losses related to cross-currency and interest rate derivative
instruments accounted for as cash flow or fair value hedges of £4.4 million and £8.5 million during the periods from April
1 to June 7, 2013 and January 1 to June 7, 2013, respectively. The effective portions of the fair value adjustments associated
with these derivative instruments, which are reflected in other comprehensive earnings (loss), aggregated net losses of £4.8
million and £10.8 million, respectively, during such periods.
(b) Represents activity related to the Virgin Media Capped Calls, as defined and described below, and, during the Successor
periods, the derivative embedded in the VM Convertible Notes, as defined and described in note 6.
(c) Included in the amount for the six months ended June 30, 2014 is a related-party derivative instrument with Liberty Global
Europe Financing BV, a subsidiary of Liberty Global, that was entered into and settled during the first quarter of 2014.
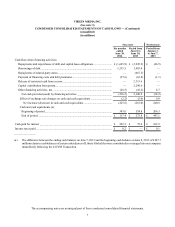
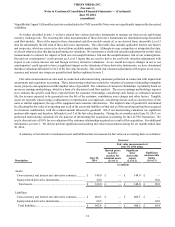
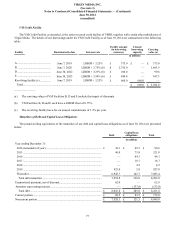
The net cash received or paid related to our derivative instruments is classified as an operating, investing or financing activity
in our condensed consolidated statements of cash flows based on the objective of the derivative instrument and the classification
of the applicable underlying cash flows. For derivative contracts that are terminated prior to maturity, the cash paid or received
upon termination that relates to future periods is classified as a financing activity. The classification of these cash inflows (outflows)
is as follows (in millions):
Successor Predecessor
Six months
ended
June 30,
2014
Period
from June
8 to June
30, 2013
Period from
January 1 to
June 7, 2013
Operating activities......................................................................................................... £(23.5) £ 0.8 £ (15.8)
Investing activities.......................................................................................................... — — 2.1
Financing activities......................................................................................................... (28.5)(10.2) —
Total........................................................................................................................... £(52.0) £ (9.4) £ (13.7)