Virgin Media 2014 Annual Report Download - page 54
Download and view the complete annual report
Please find page 54 of the 2014 Virgin Media annual report below. You can navigate through the pages in the report by either clicking on the pages listed below, or by using the keyword search tool below to find specific information within the annual report.-
 1
1 -
2
-
3
-
4
-
5
-
6
-
7
-
8
-
9
-
10
-
11
-
12
-
13
-
14
-
15
-
16
-
17
-
18
-
19
-
20
-
21
-
22
-
23
-
24
-
25
-
26
-
27
-
28
-
29
-
30
-
31
-
32
-
33
-
34
-
35
-
36
-
37
-
38
-
39
-
40
-
41
-
42
-
43
-
 44
44 -
 45
45 -
 46
46 -
 47
47 -
 48
48 -
 49
49 -
 50
50 -
 51
51 -
 52
52 -
 53
53 -
 54
54 -
 55
55 -
 56
56 -
 57
57 -
 58
58 -
 59
59 -
 60
60 -
 61
61 -
 62
62 -
 63
63 -
 64
64 -
65
-
66
-
67
-
68
-
69
-
70
-
71
-
72
-
73
-
74
-
75
 |
 |

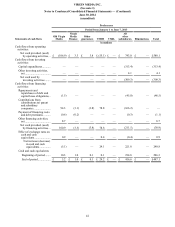
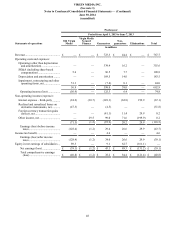
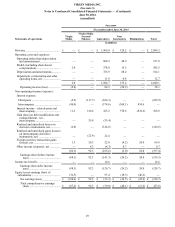
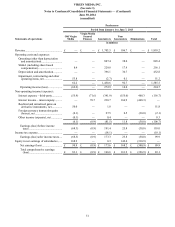
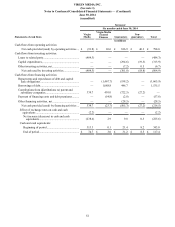
VIRGIN MEDIA INC.
(See note 1)
Notes to Condensed Consolidated Financial Statements — (Continued)
June 30, 2014
(unaudited)
52
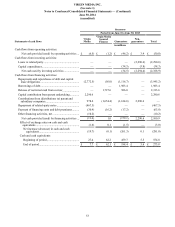
Successor
Six months ended June 30, 2014
Statements of cash flows Virgin
Media
Virgin Media
Secured
Finance Guarantors Non-
guarantors Total
in millions
Cash flows from operating activities:
Net cash provided (used) by operating activities ... £(91.8) £ 26.6 £ 816.9 £ 46.3 £ 798.0
Cash flows from investing activities:
Loans to related party.................................................. (484.3) — — — (484.3)
Capital expenditures.................................................... — — (294.6)(19.3)(313.9)
Other investing activities, net...................................... — — (7.2) 0.5 (6.7)
Net cash used by investing activities...................... (484.3) — (301.8)(18.8)(804.9)
Cash flows from financing activities:
Repayments and repurchases of debt and capital
lease obligations ...................................................... —(1,467.7)(198.2) — (1,665.9)
Borrowings of debt...................................................... — 1,088.8 446.7 — 1,535.5
Contributions from (distributions to) parent and
subsidiary companies............................................... 339.7 410.0 (722.5)(27.2) —
Payment of financing costs and debt premiums.......... —(54.8)(2.8) — (57.6)
Other financing activities, net..................................... — — (28.5) — (28.5)
Net cash provided (used) by financing activities ... 339.7 (23.7)(505.3)(27.2)(216.5)
Effect of exchange rates on cash and cash
equivalents ............................................................ (2.2) — — — (2.2)
Net increase (decrease) in cash and cash
equivalents........................................................ (238.6) 2.9 9.8 0.3 (225.6)
Cash and cash equivalents:
Beginning of period ............................................. 313.3 0.1 21.4 8.2 343.0
End of period........................................................ £ 74.7 £ 3.0 £ 31.2 £ 8.5 £ 117.4