US Cellular 2011 Annual Report Download - page 9
Download and view the complete annual report
Please find page 9 of the 2011 US Cellular annual report below. You can navigate through the pages in the report by either clicking on the pages listed below, or by using the keyword search tool below to find specific information within the annual report.-
 1
1 -
 2
2 -
 3
3 -
 4
4 -
 5
5 -
 6
6 -
 7
7 -
 8
8 -
 9
9 -
 10
10 -
 11
11 -
 12
12 -
 13
13 -
 14
14 -
 15
15 -
 16
16 -
 17
17 -
 18
18 -
 19
19 -
 20
20 -
21
-
22
-
23
-
24
-
25
-
26
-
27
-
28
-
29
-
30
-
31
-
32
-
33
-
34
-
35
-
36
-
37
-
38
-
39
-
40
-
41
-
42
-
43
-
44
-
45
-
46
-
47
-
48
-
49
-
50
-
51
-
52
-
53
-
54
-
55
-
56
-
57
-
58
-
59
-
60
-
61
-
62
-
63
-
64
-
65
-
66
-
67
-
68
-
69
-
70
-
71
-
72
-
73
-
74
-
75
-
76
-
77
-
78
-
79
-
80
-
81
-
82
-
83
-
84
-
85
-
86
-
87
-
88
 |
 |
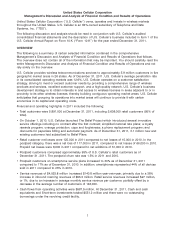
United States Cellular Corporation
Management’s Discussion and Analysis of Financial Condition and Results of Operations
United States Cellular Corporation (‘‘U.S. Cellular’’) owns, operates and invests in wireless markets
throughout the United States. U.S. Cellular is an 84%-owned subsidiary of Telephone and Data
Systems, Inc. (‘‘TDS’’).
The following discussion and analysis should be read in conjunction with U.S. Cellular’s audited
consolidated financial statements and the description of U.S. Cellular’s business included in Item 1 of the
U.S. Cellular Annual Report on Form 10-K (‘‘Form 10-K’’) for the year ended December 31, 2011.
OVERVIEW
The following is a summary of certain selected information contained in the comprehensive
Management’s Discussion and Analysis of Financial Condition and Results of Operations that follows.
The overview does not contain all of the information that may be important. You should carefully read the
entire Management’s Discussion and Analysis of Financial Condition and Results of Operations and not
rely solely on the overview.
U.S. Cellular provides wireless telecommunications services to approximately 5.9 million customers in five
geographic market areas in 26 states. As of December 31, 2011, U.S. Cellular’s average penetration rate
in its consolidated operating markets was 12.6%. U.S. Cellular operates on a customer satisfaction
strategy, striving to meet or exceed customer needs by providing a comprehensive range of wireless
products and services, excellent customer support, and a high-quality network. U.S. Cellular’s business
development strategy is to obtain interests in and access to wireless licenses in areas adjacent to or in
proximity to its other wireless licenses, thereby building contiguous operating market areas. U.S. Cellular
anticipates that grouping its operations into market areas will continue to provide it with certain
economies in its capital and operating costs.
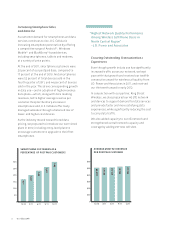
Financial and operating highlights in 2011 included the following:
• Total customers were 5,891,000 at December 31, 2011, including 5,608,000 retail customers (95% of
total).
• On October 1, 2010, U.S. Cellular launched The Belief Project which introduced several innovative
service offerings including no contract after the first contract; simplified national rate plans; a loyalty
rewards program; overage protection, caps and forgiveness; a phone replacement program; and
discounts for paperless billing and automatic payment. As of December 31, 2011, 3.1 million new and
existing customers had subscribed to Belief Plans.
• Retail customer net losses were 125,000 in 2011 compared to net losses of 15,000 in 2010. In the
postpaid category, there was a net loss of 117,000 in 2011, compared to net losses of 66,000 in 2010.
Prepaid net losses were 8,000 in 2011 compared to net additions of 51,000 in 2010.
• Postpaid customers comprised approximately 95% of U.S. Cellular’s retail customers as of
December 31, 2011. The postpaid churn rate was 1.5% in 2011 and 2010.
• Postpaid customers on smartphone service plans increased to 30% as of December 31, 2011
compared to 17% as of December 31, 2010. In addition, smartphones represented 44% of all devices
sold in 2011 compared to 25% in 2010.
• Service revenues of $4,053.8 million increased $140.8 million year-over-year, primarily due to a 38%
increase in inbound roaming revenues of $95.0 million. Retail service revenues increased $27 million,
or 1%, due to an increase in average monthly service revenue per customer, partially offset by a
decrease in the average number of customers of 146,000.
• Cash flows from operating activities were $987.9 million. At December 31, 2011, Cash and cash
equivalents and Short-term investments totaled $551.2 million and there were no outstanding
borrowings under the revolving credit facility.
1