US Cellular 2011 Annual Report Download - page 23
Download and view the complete annual report
Please find page 23 of the 2011 US Cellular annual report below. You can navigate through the pages in the report by either clicking on the pages listed below, or by using the keyword search tool below to find specific information within the annual report.-
 1
1 -
2
-
3
-
4
-
5
-
6
-
7
-
8
-
9
-
10
-
11
-
12
-
 13
13 -
 14
14 -
 15
15 -
 16
16 -
 17
17 -
 18
18 -
 19
19 -
 20
20 -
 21
21 -
 22
22 -
 23
23 -
 24
24 -
 25
25 -
 26
26 -
 27
27 -
 28
28 -
 29
29 -
 30
30 -
 31
31 -
 32
32 -
 33
33 -
34
-
35
-
36
-
37
-
38
-
39
-
40
-
41
-
42
-
43
-
44
-
45
-
46
-
47
-
48
-
49
-
50
-
51
-
52
-
53
-
54
-
55
-
56
-
57
-
58
-
59
-
60
-
61
-
62
-
63
-
64
-
65
-
66
-
67
-
68
-
69
-
70
-
71
-
72
-
73
-
74
-
75
-
76
-
77
-
78
-
79
-
80
-
81
-
82
-
83
-
84
-
85
-
86
-
87
-
88
 |
 |

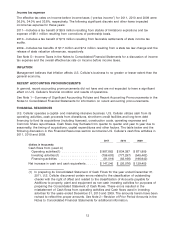
Cash payments for acquisitions in 2011, 2010 and 2009 were as follows:
Cash Payment for Acquisitions(1) 2011 2010 2009
(Dollars in millions)
Licenses .............................................. $ 4.4 $17.1 $15.8
Additional interest in operating market ......................... 19.4 — 0.2
Total ................................................. $23.8 $17.1 $16.0
(1) Cash amounts paid for the acquisitions may differ from the purchase price due to cash acquired
in the transactions and cash payments remitted in periods subsequent to the respective
transactions.
U.S. Cellular invested $110.0 million and $250.3 million in 2011 and 2010, respectively, in U.S. treasuries
and corporate notes with maturities greater than three months from the acquisition date. U.S. Cellular
realized proceeds of $145.3 million and $60.3 million in 2011 and 2010 related to the maturities of its
investments in U.S. treasuries, corporate notes and certificates of deposit.
Cash Flows from Financing Activities
Cash flows from financing activities primarily reflect changes in short-term and long-term debt balances,
distributions to noncontrolling interests, cash used to repurchase Common Shares and cash proceeds
from reissuance of Common Shares pursuant to stock-based compensation plans. U.S. Cellular has used
short-term debt to finance acquisitions, for general corporate purposes and to repurchase Common
Shares. Internally generated funds as well as proceeds from the sale of non-strategic wireless and other
investments, from time to time, have been used to reduce short-term debt.
There were no short-term borrowings or repayments during 2011, 2010 or 2009.
In May 2011, U.S. Cellular issued $342.0 million of 6.95% Senior Notes due 2060, and paid related debt
issuance costs of $11.0 million. The net proceeds from the 6.95% Senior Notes were used primarily to
redeem $330.0 million of U.S. Cellular’s 7.5% Senior Notes in June 2011. The redemption price of the
7.5% Senior Notes was equal to 100% of the principal amount plus accrued and unpaid interest thereon
to the redemption date.
In 2009, U.S. Cellular redeemed its outstanding 8.75% Senior Notes for their principal amount of
$130.0 million and retired its 9% installment notes payable in the amount of $10.0 million. There were no
redemptions of long-term debt in 2010.
U.S. Cellular repurchased Common Shares for $62.3 million, $52.8 million and $33.6 million in 2011,
2010 and 2009, respectively. See Note 15—Common Shareholders’ Equity in the Notes to Consolidated
Financial Statements for additional information related to these transactions.
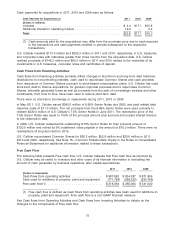
Free Cash Flow
The following table presents Free cash flow. U.S. Cellular believes that Free cash flow as reported by
U.S. Cellular may be useful to investors and other users of its financial information in evaluating the
amount of cash generated by business operations, after capital expenditures.
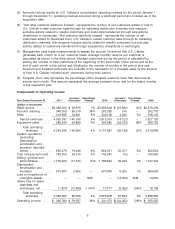
2011 2010 2009
(Dollars in thousands)
Cash flows from operating activities ................. $987,862 $ 834,387 $ 871,809
Cash used for additions to property, plant and equipment . (771,798) (569,323) (530,769)
Free cash flow(1) ............................... $216,064 $ 265,064 $ 341,040
(1) Free cash flow is defined as Cash flows from operating activities less Cash used for additions to
property, plant and equipment. Free cash flow is a non-GAAP financial measure.
See Cash flows from Operating Activities and Cash flows from Investing Activities for details on the
changes to the components of Free cash flow.
15