US Cellular 2011 Annual Report Download - page 38
Download and view the complete annual report
Please find page 38 of the 2011 US Cellular annual report below. You can navigate through the pages in the report by either clicking on the pages listed below, or by using the keyword search tool below to find specific information within the annual report.-
 1
1 -
2
-
3
-
4
-
5
-
6
-
7
-
8
-
9
-
10
-
11
-
12
-
13
-
14
-
15
-
16
-
17
-
18
-
19
-
20
-
21
-
22
-
23
-
24
-
25
-
26
-
27
-
 28
28 -
 29
29 -
 30
30 -
 31
31 -
 32
32 -
 33
33 -
 34
34 -
 35
35 -
 36
36 -
 37
37 -
 38
38 -
 39
39 -
 40
40 -
 41
41 -
 42
42 -
 43
43 -
 44
44 -
 45
45 -
 46
46 -
 47
47 -
 48
48 -
49
-
50
-
51
-
52
-
53
-
54
-
55
-
56
-
57
-
58
-
59
-
60
-
61
-
62
-
63
-
64
-
65
-
66
-
67
-
68
-
69
-
70
-
71
-
72
-
73
-
74
-
75
-
76
-
77
-
78
-
79
-
80
-
81
-
82
-
83
-
84
-
85
-
86
-
87
-
88
 |
 |

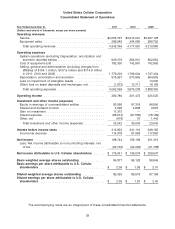
United States Cellular Corporation
Consolidated Statement of Cash Flows
Year Ended December 31, 2011 2010 2009
(Dollars in thousands)
Cash flows from operating activities
Net income ............................................. $198,744 $ 159,158 $ 231,315
Add (deduct) adjustments to reconcile net income to net cash flows from
operating activities
Depreciation, amortization and accretion ...................... 573,557 570,955 564,935
Bad debts expense .................................... 62,157 76,292 107,991
Stock-based compensation expense ......................... 20,183 18,044 16,362
Deferred income taxes, net ............................... 203,264 73,727 47,260
Equity in earnings of unconsolidated entities ................... (83,566) (97,318) (96,800)
Distributions from unconsolidated entities ..................... 91,768 100,359 91,105
Loss on impairment of intangible assets ...................... — — 14,000
(Gain) loss on asset disposals and exchanges, net ............... (1,873) 10,717 16,169
Gain on investment .................................... (11,373) — —
Noncash interest expense ................................ 10,040 2,540 2,442
Other operating activities ................................. 102 (2,483) (24)
Changes in assets and liabilities from operations
Accounts receivable .................................... (82,175) (75,252) (114,646)
Inventory ........................................... (14,640) 40,277 (35,992)
Accounts payable—trade ................................ 28,410 (52,568) 36,195
Accounts payable—affiliate ............................... 1,392 (3,940) 5,119
Customer deposits and deferred revenues ..................... 34,927 6,180 (9,921)
Accrued taxes ........................................ (39,984) (70,057) 48,218
Accrued interest ...................................... 225 204 (2,121)
Other assets and liabilities ................................ (3,296) 77,552 (49,798)
987,862 834,387 871,809
Cash flows from investing activities
Cash used for additions to property, plant and equipment ............. (771,798) (569,323) (530,769)
Cash received from divestitures ............................... — — 50
Cash paid for acquisitions and licenses .......................... (23,773) (17,101) (16,027)
Cash paid for investments ................................... (110,000) (250,250) (450)
Cash received for investments ................................ 145,250 60,330 120
Other investing activities .................................... 718 (953) 1,614
(759,603) (777,297) (545,462)
Cash flows from financing activities
Repayment of long-term debt ................................ (330,338) (316) (140,236)
Issuance of long-term debt .................................. 342,000 — —
Common shares reissued for benefit plans, net of tax payments ......... 1,935 509 (82)
Common shares repurchased ................................ (62,294) (52,827) (33,585)
Payment of debt issuance costs ............................... (11,400) (2,229) (4,421)
Distributions to noncontrolling interests .......................... (21,094) (19,631) (18,426)
Payments to acquire additional interest in subsidiaries ................ — (8,786) (285)
Other financing activities .................................... 172 114 93
(81,019) (83,166) (196,942)
Net increase (decrease) in cash and cash equivalents ............... 147,240 (26,076) 129,405
Cash and cash equivalents
Beginning of period ....................................... 276,915 302,991 173,586
End of period ........................................... $424,155 $ 276,915 $ 302,991
The accompanying notes are an integral part of these consolidated financial statements.
30