US Cellular 2011 Annual Report Download - page 14
Download and view the complete annual report
Please find page 14 of the 2011 US Cellular annual report below. You can navigate through the pages in the report by either clicking on the pages listed below, or by using the keyword search tool below to find specific information within the annual report.-
 1
1 -
2
-
3
-
 4
4 -
 5
5 -
 6
6 -
 7
7 -
 8
8 -
 9
9 -
 10
10 -
 11
11 -
 12
12 -
 13
13 -
 14
14 -
 15
15 -
 16
16 -
 17
17 -
 18
18 -
 19
19 -
 20
20 -
 21
21 -
 22
22 -
 23
23 -
 24
24 -
25
-
26
-
27
-
28
-
29
-
30
-
31
-
32
-
33
-
34
-
35
-
36
-
37
-
38
-
39
-
40
-
41
-
42
-
43
-
44
-
45
-
46
-
47
-
48
-
49
-
50
-
51
-
52
-
53
-
54
-
55
-
56
-
57
-
58
-
59
-
60
-
61
-
62
-
63
-
64
-
65
-
66
-
67
-
68
-
69
-
70
-
71
-
72
-
73
-
74
-
75
-
76
-
77
-
78
-
79
-
80
-
81
-
82
-
83
-
84
-
85
-
86
-
87
-
88
 |
 |

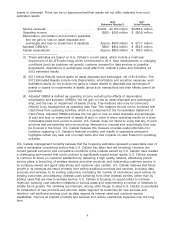
(5) Amounts include results for U.S. Cellular’s consolidated operating markets for the period January 1
through December 31; operating markets acquired during a particular period are included as of the
acquisition date.
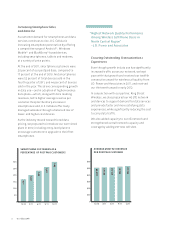
(6) ‘‘Net retail customer additions (losses)’’ represents the number of net customers added or lost to
U.S. Cellular’s retail customer base through its marketing distribution channels; this measure
excludes activity related to reseller customers and customers transferred through acquisitions,
divestitures or exchanges. ‘‘Net customer additions (losses)’’ represents the number of net
customers added to (deducted from) U.S. Cellular’s overall customer base through its marketing
distribution channels; this measure includes activity related to reseller customers but excludes
activity related to customers transferred through acquisitions, divestitures or exchanges.
(7) Management uses these measurements to assess the amount of revenue that U.S. Cellular
generates each month on a per customer basis. Average monthly revenue per customer is
calculated as shown in the table above. Average customers during the period is calculated by
adding the number of total customers at the beginning of the first month of the period and at the
end of each month in the period and dividing by the number of months in the period plus one.
Acquired and divested customers are included in the calculation on a prorated basis for the amount
of time U.S. Cellular included such customers during each period.
(8) Postpaid churn rate represents the percentage of the postpaid customer base that disconnects
service each month. This amount represents the average postpaid churn rate for the twelve months
of the respective year.
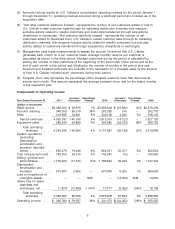
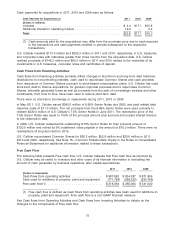
Components of Operating Income
Increase/ Percentage Increase/ Percentage
Year Ended December 31, 2011 (Decrease) Change 2010 (Decrease) Change 2009
(Dollars in thousands)
Retail service .........$3,486,522 $ 26,976 1% $3,459,546 $ (18,662) (1)% $3,478,208
Inbound roaming ...... 348,309 95,019 38% 253,290 515 — 252,775
Other .............. 218,966 18,801 9% 200,165 4,020 2% 196,145
Service revenues .... 4,053,797 140,796 4% 3,913,001 (14,127) — 3,927,128
Equipment sales ...... 289,549 24,869 9% 264,680 (22,072) (8)% 286,752
Total operating
revenues ....... 4,343,346 165,665 4% 4,177,681 (36,199) (1)% 4,213,880
System operations
(excluding
Depreciation,
amortization and
accretion reported
below) ............ 929,379 74,448 9% 854,931 52,077 6% 802,854
Cost of equipment sold . 782,300 39,319 5% 742,981 (12) — 742,993
Selling, general and
administrative ....... 1,779,203 (17,421) (1)% 1,796,624 49,220 3% 1,747,404
Depreciation,
amortization and
accretion .......... 573,557 2,602 — 570,955 6,020 1% 564,935
Loss on impairment of
intangible assets ..... — — N/M — (14,000) N/M 14,000
(Gain) loss on asset
disposals and
exchanges, net ...... (1,873) (12,590) >100% 10,717 (5,452) (34)% 16,169
Total operating
expenses ....... 4,062,566 86,358 2% 3,976,208 87,853 2% 3,888,355
Operating income .....$ 280,780 $ 79,307 39% $ 201,473 $(124,052) (38)% $ 325,525
6