US Cellular 2011 Annual Report Download - page 2
Download and view the complete annual report
Please find page 2 of the 2011 US Cellular annual report below. You can navigate through the pages in the report by either clicking on the pages listed below, or by using the keyword search tool below to find specific information within the annual report.-
 1
1 -
 2
2 -
 3
3 -
 4
4 -
 5
5 -
 6
6 -
 7
7 -
 8
8 -
 9
9 -
 10
10 -
 11
11 -
 12
12 -
 13
13 -
14
-
15
-
16
-
17
-
18
-
19
-
20
-
21
-
22
-
23
-
24
-
25
-
26
-
27
-
28
-
29
-
30
-
31
-
32
-
33
-
34
-
35
-
36
-
37
-
38
-
39
-
40
-
41
-
42
-
43
-
44
-
45
-
46
-
47
-
48
-
49
-
50
-
51
-
52
-
53
-
54
-
55
-
56
-
57
-
58
-
59
-
60
-
61
-
62
-
63
-
64
-
65
-
66
-
67
-
68
-
69
-
70
-
71
-
72
-
73
-
74
-
75
-
76
-
77
-
78
-
79
-
80
-
81
-
82
-
83
-
84
-
85
-
86
-
87
-
88
 |
 |

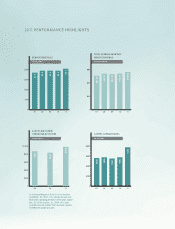
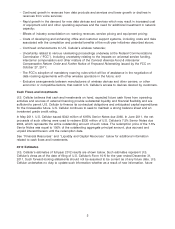
PERFORMANCE HIGHLIGHTS
CASH FLOWS FROM
OPERATING ACTIVITIES
(IN MILLIONS)
$1,000
$800
$600
$400
$200
0
09 10 11
$988
$834
$872
TOTAL AVERAGE MONTHLY
SERVICE REVENUE
(PER CUSTOMER)
$60
$40
$20
0
07 08 09 10 11
$53.22
$51.08
$53.27
$56.54
$52.99
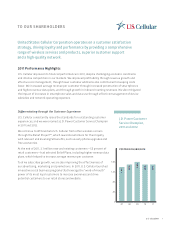
SERVICE REVENUES
(IN BILLIONS)
07 08 09 10 11
$4.1
$3.9
$3.9
$3.9
$3.7
$4.0
$3.0
$2.0
$1.0
0
CAPITAL EXPENDITURES
(IN MILLIONS)
$800
$600
$400
$200
0
07 08 09 10 11
$783
$583
$547
$586
$565
In its Annual Report on Form 10-K for the year
ended Dec. 31, 2011, U.S. Cellular revised cash
flows from operating activities for the years ended
Dec. 31, 2010 and Dec. 31, 2009. This chart
includes only the periods that have been revised
to reflect the proper amounts.
•
•
•
•
•