US Cellular 2011 Annual Report Download - page 21
Download and view the complete annual report
Please find page 21 of the 2011 US Cellular annual report below. You can navigate through the pages in the report by either clicking on the pages listed below, or by using the keyword search tool below to find specific information within the annual report.-
 1
1 -
2
-
3
-
4
-
5
-
6
-
7
-
8
-
9
-
10
-
 11
11 -
 12
12 -
 13
13 -
 14
14 -
 15
15 -
 16
16 -
 17
17 -
 18
18 -
 19
19 -
 20
20 -
 21
21 -
 22
22 -
 23
23 -
 24
24 -
 25
25 -
 26
26 -
 27
27 -
 28
28 -
 29
29 -
 30
30 -
 31
31 -
32
-
33
-
34
-
35
-
36
-
37
-
38
-
39
-
40
-
41
-
42
-
43
-
44
-
45
-
46
-
47
-
48
-
49
-
50
-
51
-
52
-
53
-
54
-
55
-
56
-
57
-
58
-
59
-
60
-
61
-
62
-
63
-
64
-
65
-
66
-
67
-
68
-
69
-
70
-
71
-
72
-
73
-
74
-
75
-
76
-
77
-
78
-
79
-
80
-
81
-
82
-
83
-
84
-
85
-
86
-
87
-
88
 |
 |

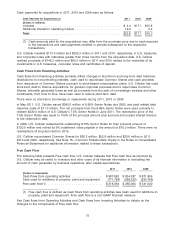
Cash Flows from Operating Activities
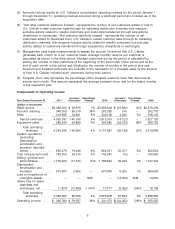
The following table presents Adjusted OIBDA and is included for purposes of analyzing changes in
operating activities. U.S. Cellular believes this measure provides useful information to investors regarding
U.S. Cellular’s financial condition and results of operations because it highlights certain key cash and
non-cash items and their impacts on cash flows from operating activities.
2011 2010 2009
(Dollars in thousands)
Operating income ................................ $280,780 $201,473 $325,525
Non-cash items
Depreciation, amortization and accretion .............. 573,557 570,955 564,935
Loss on impairment of intangible assets .............. — — 14,000
(Gain) loss on asset disposals, net .................. (1,873) 10,717 16,169
Adjusted OIBDA(1) ............................... $852,464 $783,145 $920,629
(1) Adjusted OIBDA is defined as operating income excluding the effects of: depreciation,
amortization and accretion (OIBDA); the net gain or loss on asset disposals (if any); and the
loss on impairment of assets (if any). This measure may commonly be referred to by
management as operating cash flow. This measure should not be confused with Cash flows
from operating activities, which is a component of the Consolidated Statement of Cash Flows.
Adjusted OIBDA excludes the net gain or loss on asset disposals and loss on impairment of
assets (if any), in order to show operating results on a more comparable basis from period to
period. U.S. Cellular does not intend to imply that any of such amounts that are excluded are
non-recurring, infrequent or unusual and, accordingly, they may be incurred in the future.
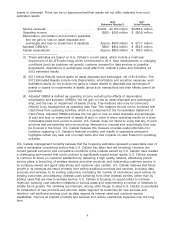
Cash flows from operating activities in 2011 were $987.9 million, an increase of $153.5 million from 2010.
Significant changes included the following:
• Adjusted OIBDA, as shown in the table above, increased by $69.3 million primarily due to an increase
in operating income. See discussion in the ‘‘Results of Operations’’ for factors that affected operating
income.
• Income tax refunds, net of $54.4 million were recorded in 2011 compared to income tax payments, net
of $53.1 million in 2010 resulting in a $107.5 million year-over-year increase in cash flows. Tax refunds
of $35.0 million and $21.0 million were received in March and September 2011, respectively, related to
the 2010 tax year. U.S. Cellular incurred a federal net operating loss in 2011 attributed to 100% bonus
depreciation applicable to qualified capital expenditures. U.S. Cellular’s future federal income tax
liabilities associated with the current benefits being realized from bonus depreciation are accrued as a
component of Net deferred income tax liability (noncurrent) in the Consolidated Balance Sheet. U.S.
Cellular expects federal income tax payments to substantially increase and remain at a higher level for
several years as the amount of U.S. Cellular’s federal tax depreciation deduction substantially
decreases as a result of having accelerated depreciation into prior years. This expectation assumes
that federal bonus depreciation provisions are not enacted in future periods. To the extent further
federal bonus depreciation provisions are enacted, this expectation will change.
• Changes in Inventory required $14.6 million in 2011 and provided $40.3 million in 2010, resulting in a
$54.9 million decrease in cash flows. This change was primarily due to higher inventory levels and a
change in inventory mix resulting in a higher cost per unit.
• Changes in Accounts payable provided $29.8 million in 2011 and required $56.5 million in 2010,
causing a year-over-year increase in cash flows of $86.3 million. Changes in Accounts payable were
primarily driven by payment timing differences related to network equipment and device purchases.
• Changes in Customer deposits and deferred revenues provided $34.9 million and $6.2 million in 2011
and 2010, respectively, resulting in a year-over-year increase in cash flows of $28.7 million. This
change was primarily driven by deferred revenues related to the loyalty reward program.
• Changes in Other assets and liabilities required $3.3 million and provided $77.6 million in 2011 and
2010, respectively, causing a year-over-year net decrease in cash flows of $80.8 million. In 2009, a
13