US Cellular 2011 Annual Report Download - page 17
Download and view the complete annual report
Please find page 17 of the 2011 US Cellular annual report below. You can navigate through the pages in the report by either clicking on the pages listed below, or by using the keyword search tool below to find specific information within the annual report.-
 1
1 -
2
-
3
-
4
-
5
-
6
-
 7
7 -
 8
8 -
 9
9 -
 10
10 -
 11
11 -
 12
12 -
 13
13 -
 14
14 -
 15
15 -
 16
16 -
 17
17 -
 18
18 -
 19
19 -
 20
20 -
 21
21 -
 22
22 -
 23
23 -
 24
24 -
 25
25 -
 26
26 -
 27
27 -
28
-
29
-
30
-
31
-
32
-
33
-
34
-
35
-
36
-
37
-
38
-
39
-
40
-
41
-
42
-
43
-
44
-
45
-
46
-
47
-
48
-
49
-
50
-
51
-
52
-
53
-
54
-
55
-
56
-
57
-
58
-
59
-
60
-
61
-
62
-
63
-
64
-
65
-
66
-
67
-
68
-
69
-
70
-
71
-
72
-
73
-
74
-
75
-
76
-
77
-
78
-
79
-
80
-
81
-
82
-
83
-
84
-
85
-
86
-
87
-
88
 |
 |
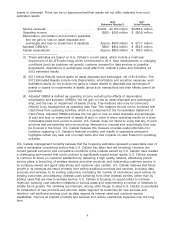
in 2010 equipment sales revenues was driven by declines of 5% in total wireless devices sold and 5% in
average revenue per wireless device sold. Average revenue per wireless device sold declined due to
aggressive promotional pricing across all categories of wireless devices.
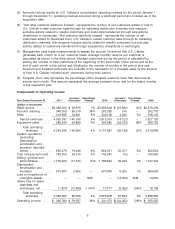
Operating Expenses
System operations expenses (excluding Depreciation, amortization and accretion)
System operations expenses (excluding Depreciation, amortization and accretion) include charges from
telecommunications service providers for U.S. Cellular’s customers’ use of their facilities, costs related to
local interconnection to the wireline network, charges for cell site rent and maintenance of U.S. Cellular’s
network, long-distance charges, outbound roaming expenses and payments to third-party data product
and platform developers.
Key components of the overall increases in System operations expenses were as follows:
• Expenses incurred when U.S. Cellular’s customers used other carriers’ networks while roaming
increased $45.4 million, or 22%, in 2011 and $2.6 million, or 1%, in 2010. The increases were primarily
due to increases from data roaming offset by a decline in voice roaming expenses.
• Maintenance, utility and cell site expenses increased $26.4 million, or 7%, in 2011 and $25.2 million, or
8%, in 2010, driven primarily by increases in the number of cell sites within U.S. Cellular’s network.
The number of cell sites totaled 7,882, 7,645 and 7,279 in 2011, 2010 and 2009, respectively, as U.S.
Cellular continued to expand and enhance coverage in its existing markets. The increases in expenses
were also due to an increase in software maintenance costs to support rapidly growing data needs.
• Customer usage expenses increased by $2.7 million, or 1%, in 2011, and $24.2 million, or 9%, in 2010,
primarily due to an increase in data usage in both years.
U.S. Cellular expects total system operations expenses to increase on a year-over-year basis in the
foreseeable future to support the continued growth in cell sites and other network facilities as it
continues to add capacity, enhance quality and deploy new technologies as well as to support increases
in total customer usage, particularly data usage.
Cost of equipment sold
Cost of equipment sold increased by 5% in 2011 compared to 2010 and remained relatively flat in 2010
compared to 2009. In both years, a decline in total wireless devices sold was offset by an increase in the
average cost per wireless device sold due to a shift in the mix of sales to wireless devices with expanded
capabilities, such as smartphones.
U.S. Cellular’s loss on equipment, defined as equipment sales revenues less cost of equipment sold,
was $492.8 million, $478.3 million and $456.2 million for 2011, 2010 and 2009, respectively. U.S. Cellular
expects loss on equipment to continue to be a significant cost in the foreseeable future as wireless
carriers continue to use device availability and pricing as a means of competitive differentiation. In
addition, U.S. Cellular expects increasing sales of data centric wireless devices such as smartphones
and tablets to result in higher equipment subsidies over time; these devices generally have higher
purchase costs which cannot be recovered through proportionately higher selling prices to customers.
Smartphones sold as a percentage of total devices sold was 44%, 25% and 10% in 2011, 2010 and
2009, respectively.
Selling, general and administrative expenses
Selling, general and administrative expenses include salaries, commissions and expenses of field sales
and retail personnel and facilities; telesales department salaries and expenses; agent commissions and
related expenses; corporate marketing and merchandise management; and advertising expenses.
Selling, general and administrative expenses also include bad debts expense, costs of operating
customer care centers and corporate expenses.
9