US Cellular 2011 Annual Report Download - page 61
Download and view the complete annual report
Please find page 61 of the 2011 US Cellular annual report below. You can navigate through the pages in the report by either clicking on the pages listed below, or by using the keyword search tool below to find specific information within the annual report.-
 1
1 -
2
-
3
-
4
-
5
-
6
-
7
-
8
-
9
-
10
-
11
-
12
-
13
-
14
-
15
-
16
-
17
-
18
-
19
-
20
-
21
-
22
-
23
-
24
-
25
-
26
-
27
-
28
-
29
-
30
-
31
-
32
-
33
-
34
-
35
-
36
-
37
-
38
-
39
-
40
-
41
-
42
-
43
-
44
-
45
-
46
-
47
-
48
-
49
-
50
-
 51
51 -
 52
52 -
 53
53 -
 54
54 -
 55
55 -
 56
56 -
 57
57 -
 58
58 -
 59
59 -
 60
60 -
 61
61 -
 62
62 -
 63
63 -
 64
64 -
 65
65 -
 66
66 -
 67
67 -
 68
68 -
 69
69 -
 70
70 -
 71
71 -
72
-
73
-
74
-
75
-
76
-
77
-
78
-
79
-
80
-
81
-
82
-
83
-
84
-
85
-
86
-
87
-
88
 |
 |

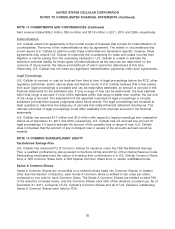
UNITED STATES CELLULAR CORPORATION
NOTES TO CONSOLIDATED FINANCIAL STATEMENTS (Continued)
NOTE 6 VARIABLE INTEREST ENTITIES (VIEs) (Continued)
permitted. Pursuant to GAAP, this theoretical redemption value, net of amounts payable to U.S. Cellular
for loans (and accrued interest thereon) made by U.S. Cellular to the general partners, was $1.0 million
and $0.9 million at December 31, 2011 and 2010, respectively, and is recorded as Noncontrolling
interests with redemption features in U.S. Cellular’s Consolidated Balance Sheet. Also in accordance with
GAAP, changes in the redemption value of the put options, net of interest accrued on the loans, are
recorded as a component of Net income attributable to noncontrolling interests, net of tax, in U.S.
Cellular’s Consolidated Statements of Operations.
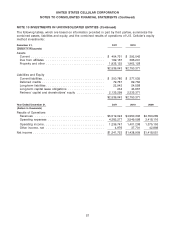
These VIEs are in the process of developing long-term business plans. These entities were formed to
participate in FCC auctions of wireless spectrum and to fund, establish, and provide wireless service with
respect to any FCC licenses won in the auctions. As such, these entities have risks similar to those
described in the ‘‘Risk Factors’’ in U.S. Cellular’s Annual Report on Form 10-K.
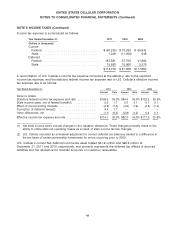
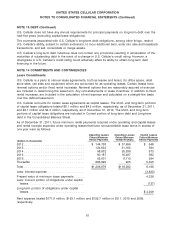
NOTE 7 EARNINGS PER SHARE
Basic earnings per share attributable to U.S. Cellular shareholders is computed by dividing Net income
attributable to U.S. Cellular shareholders by the weighted average number of common shares
outstanding during the period. Diluted earnings per share attributable to U.S. Cellular shareholders is
computed by dividing Net income attributable to U.S. Cellular shareholders by the weighted average
number of common shares outstanding during the period adjusted to include the effects of potentially
dilutive securities. Potentially dilutive securities primarily include incremental shares issuable upon
exercise of outstanding stock options and the vesting of restricted stock units.
The amounts used in computing Earnings per Common and Series A Common Share and the effects of
potentially dilutive securities on the weighted average number of Common and Series A Common Shares
are as follows:
Year ended December 31, 2011 2010 2009
(Dollars and shares in thousands, except earnings per share)
Net income attributable to U.S. Cellular shareholders ............. $175,041 $136,074 $209,547
Weighted average number of shares used in basic earnings per share 84,877 86,128 86,946
Effect of dilutive securities:
Stock options ........................................ 114 89 21
Restricted stock units .................................. 344 301 201
Weighted average number of shares used in diluted earnings per share 85,335 86,518 87,168
Basic earnings per share attributable to U.S. Cellular shareholders . . . $ 2.06 $ 1.58 $ 2.41
Diluted earnings per share attributable to U.S. Cellular shareholders . . $ 2.05 $ 1.57 $ 2.40
Certain Common Shares issuable upon the exercise of stock options or vesting of restricted stock units
were not included in average diluted shares outstanding for the calculation of Diluted earnings per share
because their effects were antidilutive. The number of such Common Shares excluded is shown in the
table below.
2011 2010 2009
(Shares in thousands)
Stock options .................................... 1,399 1,771 2,045
Restricted stock units ............................... 215 224 193
53