US Cellular 2011 Annual Report Download - page 19
Download and view the complete annual report
Please find page 19 of the 2011 US Cellular annual report below. You can navigate through the pages in the report by either clicking on the pages listed below, or by using the keyword search tool below to find specific information within the annual report.-
 1
1 -
2
-
3
-
4
-
5
-
6
-
7
-
8
-
 9
9 -
 10
10 -
 11
11 -
 12
12 -
 13
13 -
 14
14 -
 15
15 -
 16
16 -
 17
17 -
 18
18 -
 19
19 -
 20
20 -
 21
21 -
 22
22 -
 23
23 -
 24
24 -
 25
25 -
 26
26 -
 27
27 -
 28
28 -
 29
29 -
30
-
31
-
32
-
33
-
34
-
35
-
36
-
37
-
38
-
39
-
40
-
41
-
42
-
43
-
44
-
45
-
46
-
47
-
48
-
49
-
50
-
51
-
52
-
53
-
54
-
55
-
56
-
57
-
58
-
59
-
60
-
61
-
62
-
63
-
64
-
65
-
66
-
67
-
68
-
69
-
70
-
71
-
72
-
73
-
74
-
75
-
76
-
77
-
78
-
79
-
80
-
81
-
82
-
83
-
84
-
85
-
86
-
87
-
88
 |
 |

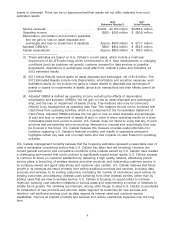
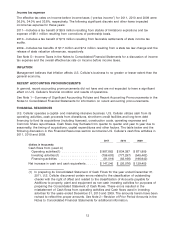
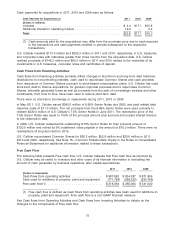
Components of Other Income (Expense)
Increase/ Percentage Increase/ Percentage
Year Ended December 31, 2011 (Decrease) Change 2010 (Decrease) Change 2009
(Dollars in thousands)
Operating income .........$280,780 $ 79,307 39% $201,473 $(124,052) (38)% $325,525
Equity in earnings of
unconsolidated entities .... 83,566 (13,752) (14)% 97,318 518 1% 96,800
Interest and dividend income . 3,395 (413) (11)% 3,808 211 6% 3,597
Gain on investments ....... 11,373 11,373 N/M — — N/M —
Interest expense .......... (65,614) (4,059) (7)% (61,555) 16,644 21% (78,199)
Other, net ............... (678) (750) >100% 72 (1,370) (95)% 1,442
Total investment and other
income ............... 32,042 (7,601) (19)% 39,643 16,003 68% 23,640
Income before income taxes . . 312,822 71,706 30% 241,116 (108,049) (31)% 349,165
Income tax expense ........ 114,078 (32,120) (39)% 81,958 35,892 30% 117,850
Net income .............. 198,744 39,586 25% 159,158 (72,157) (31)% 231,315
Less: Net income attributable
to noncontrolling interests,
net of tax .............. (23,703) (619) (3)% (23,084) (1,316) (6)% (21,768)
Net income attributable to U.S.
Cellular shareholders .....$175,041 $ 38,967 29% $136,074 $ (73,473) (35)% $209,547
N/M—Percentage change not meaningful
Equity in earnings of unconsolidated entities
Equity in earnings of unconsolidated entities represents U.S. Cellular’s share of net income from entities
accounted for by the equity method of accounting. U.S. Cellular generally follows the equity method of
accounting for unconsolidated entities in which its ownership interest is less than or equal to 50% but
equals or exceeds 20% for corporations and 3% for partnerships and limited liability companies.
U.S. Cellular’s investment in the Los Angeles SMSA Limited Partnership (‘‘LA Partnership’’) contributed
$55.3 million, $64.8 million and $66.1 million to Equity in earnings of unconsolidated entities in 2011,
2010 and 2009, respectively. U.S. Cellular received cash distributions from the LA Partnership of
$66.0 million in each of 2011, 2010 and 2009.
Gain on disposition of investments
On May 9, 2011, U.S. Cellular paid $24.6 million in cash to purchase the remaining ownership interest in
a wireless business in which it previously held a noncontrolling interest. In connection with this
transaction, a $13.4 million gain was recorded. See Note 8—Acquisitions, Divestitures and Exchanges in
the Notes to Consolidated Financial Statements for additional information.
Interest expense
Interest expense increased in 2011 compared to 2010 primarily due to the write-off of unamortized debt
issuance costs of $8.2 million for U.S. Cellular’s $330 million, 7.5% senior notes redeemed on June 20,
2011. This was partially offset by the capitalization of interest for multi-year projects and lower interest
rates on outstanding debt. Interest expense decreased in 2010 compared to 2009 primarily due to the
redemption of U.S. Cellular’s $130.0 million, 8.75% Senior Notes in December 2009.
11