US Cellular 2011 Annual Report Download - page 13
Download and view the complete annual report
Please find page 13 of the 2011 US Cellular annual report below. You can navigate through the pages in the report by either clicking on the pages listed below, or by using the keyword search tool below to find specific information within the annual report.-
 1
1 -
2
-
 3
3 -
 4
4 -
 5
5 -
 6
6 -
 7
7 -
 8
8 -
 9
9 -
 10
10 -
 11
11 -
 12
12 -
 13
13 -
 14
14 -
 15
15 -
 16
16 -
 17
17 -
 18
18 -
 19
19 -
 20
20 -
 21
21 -
 22
22 -
 23
23 -
24
-
25
-
26
-
27
-
28
-
29
-
30
-
31
-
32
-
33
-
34
-
35
-
36
-
37
-
38
-
39
-
40
-
41
-
42
-
43
-
44
-
45
-
46
-
47
-
48
-
49
-
50
-
51
-
52
-
53
-
54
-
55
-
56
-
57
-
58
-
59
-
60
-
61
-
62
-
63
-
64
-
65
-
66
-
67
-
68
-
69
-
70
-
71
-
72
-
73
-
74
-
75
-
76
-
77
-
78
-
79
-
80
-
81
-
82
-
83
-
84
-
85
-
86
-
87
-
88
 |
 |

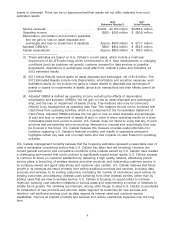
RESULTS OF OPERATIONS
Following is a table of summarized operating data for U.S. Cellular’s consolidated operations.
As of December 31,(1) 2011 2010 2009
Customers
Customers on postpaid service plans in which the end user is a
customer of U.S. Cellular (‘‘postpaid customers’’) .......... 5,302,000 5,416,000 5,482,000
Customers on prepaid service plans in which the end user is a
customer of U.S. Cellular (‘‘prepaid customers’’) ........... 306,000 313,000 262,000
Total retail customers ................................ 5,608,000 5,729,000 5,744,000
End user customers acquired through U.S. Cellular’s
agreements with third parties (‘‘reseller customers’’) ........ 283,000 343,000 397,000
Total customers .................................... 5,891,000 6,072,000 6,141,000
Total market population of consolidated operating markets(2) . . . 46,888,000 46,546,000 46,306,000
Market penetration in consolidated operating markets(2) ..... 12.6% 13.0% 13.3%
Total market population of consolidated operating and
non-operating markets(2) ........................... 91,965,000 90,468,000 89,712,000
Market penetration in consolidated operating and non-operating
markets(2) ...................................... 6.4% 6.7% 6.8%
Employees
Full-time employees ................................. 7,711 8,200 8,070
Part-time employees ................................ 1,032 1,049 1,170
Total employees ................................... 8,743 9,249 9,240
Cell sites in service ................................. 7,882 7,645 7,279
Smartphone penetration(3)(4) .......................... 30.5% 16.7% 7.0%
For the Year Ended December 31,(5) 2011 2010 2009
Net retail customer additions (losses)(6) .................. (125,000) (15,000) 37,000
Net customer losses(6) .............................. (186,000) (69,000) (55,000)
Average monthly service revenue per customer(7)
Service revenues per Consolidated Statement of Operations
(000s) ......................................... $4,053,797 $3,913,001 $3,927,128
Divided by total average customers during period (000s) ...... 5,975 6,121 6,176
Divided by number of months in each period .............. 12 12 12
Average monthly service revenue per customer ............. $ 56.54 $ 53.27 $ 52.99
Postpaid churn rate(8) ............................... 1.5% 1.5% 1.6%
Smartphones sold as a percent of total devices sold(3) ....... 44.0% 24.6% 10.2%
(1) Amounts include results for U.S. Cellular’s consolidated operating markets as of December 31.
(2) Calculated using 2010, 2009 and 2008 Claritas population estimates for 2011, 2010 and 2009,
respectively. ‘‘Total market population of consolidated operating markets’’ is used only for the
purposes of calculating market penetration of consolidated operating markets, which is calculated by
dividing customers by the total market population (without duplication of population in overlapping
markets).
The total market population and penetration measures for consolidated operating markets apply to
markets in which U.S. Cellular provides wireless service to customers.
(3) Smartphones represent wireless devices which run on an AndroidTM, BlackBerryᓼ or Windows
Mobileᓼ, operating systems, excluding tablets.
(4) Smartphone penetration is calculated by dividing postpaid smartphone customers by total postpaid
customers.
5