US Cellular 2011 Annual Report Download - page 65
Download and view the complete annual report
Please find page 65 of the 2011 US Cellular annual report below. You can navigate through the pages in the report by either clicking on the pages listed below, or by using the keyword search tool below to find specific information within the annual report.-
 1
1 -
2
-
3
-
4
-
5
-
6
-
7
-
8
-
9
-
10
-
11
-
12
-
13
-
14
-
15
-
16
-
17
-
18
-
19
-
20
-
21
-
22
-
23
-
24
-
25
-
26
-
27
-
28
-
29
-
30
-
31
-
32
-
33
-
34
-
35
-
36
-
37
-
38
-
39
-
40
-
41
-
42
-
43
-
44
-
45
-
46
-
47
-
48
-
49
-
50
-
51
-
52
-
53
-
54
-
 55
55 -
 56
56 -
 57
57 -
 58
58 -
 59
59 -
 60
60 -
 61
61 -
 62
62 -
 63
63 -
 64
64 -
 65
65 -
 66
66 -
 67
67 -
 68
68 -
 69
69 -
 70
70 -
 71
71 -
 72
72 -
 73
73 -
 74
74 -
 75
75 -
76
-
77
-
78
-
79
-
80
-
81
-
82
-
83
-
84
-
85
-
86
-
87
-
88
 |
 |

UNITED STATES CELLULAR CORPORATION
NOTES TO CONSOLIDATED FINANCIAL STATEMENTS (Continued)
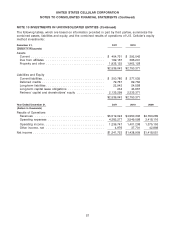
NOTE 10 INVESTMENTS IN UNCONSOLIDATED ENTITIES (Continued)
The following tables, which are based on information provided in part by third parties, summarize the
combined assets, liabilities and equity, and the combined results of operations of U.S. Cellular’s equity
method investments:
December 31, 2011 2010
(Dollars in thousands)
Assets
Current ........................................ $ 404,751 $ 392,042
Due from affiliates ................................ 199,167 396,201
Property and other ................................ 1,935,125 1,962,128
$2,539,043 $2,750,371
Liabilities and Equity
Current liabilities .................................. $ 300,780 $ 277,035
Deferred credits .................................. 79,787 69,750
Long-term liabilities ................................ 22,943 24,558
Long-term capital lease obligations .................... 234 43,657
Partners’ capital and shareholders’ equity ............... 2,135,299 2,335,371
$2,539,043 $2,750,371
Year Ended December 31, 2011 2010 2009
(Dollars in thousands)
Results of Operations
Revenues ...................................... $5,519,024 $4,950,306 $4,793,269
Operating expenses ............................... 4,282,277 3,549,098 3,418,116
Operating income ................................. 1,236,747 1,401,208 1,375,153
Other income, net ................................ 4,976 37,701 42,898
Net income ....................................... $1,241,723 $1,438,909 $1,418,051
57