UPS 2009 Annual Report Download - page 88
Download and view the complete annual report
Please find page 88 of the 2009 UPS annual report below. You can navigate through the pages in the report by either clicking on the pages listed below, or by using the keyword search tool below to find specific information within the annual report.-
 1
1 -
2
-
3
-
4
-
5
-
6
-
7
-
8
-
9
-
10
-
11
-
12
-
13
-
14
-
15
-
16
-
17
-
18
-
19
-
20
-
21
-
22
-
23
-
24
-
25
-
26
-
27
-
28
-
29
-
30
-
31
-
32
-
33
-
34
-
35
-
36
-
37
-
38
-
39
-
40
-
41
-
42
-
43
-
44
-
45
-
46
-
47
-
48
-
49
-
50
-
51
-
52
-
53
-
54
-
55
-
56
-
57
-
58
-
59
-
60
-
61
-
62
-
63
-
64
-
65
-
66
-
67
-
68
-
69
-
70
-
71
-
72
-
73
-
74
-
75
-
76
-
77
-
 78
78 -
 79
79 -
 80
80 -
 81
81 -
 82
82 -
 83
83 -
 84
84 -
 85
85 -
 86
86 -
 87
87 -
 88
88 -
 89
89 -
 90
90 -
 91
91 -
 92
92 -
 93
93 -
 94
94 -
 95
95 -
 96
96 -
 97
97 -
 98
98 -
99
-
100
-
101
-
102
-
103
-
104
-
105
-
106
-
107
-
108
-
109
-
110
-
111
-
112
-
113
-
114
-
115
-
116
-
117
-
118
-
119
-
120
-
121
-
122
-
123
-
124
-
125
-
126
-
127
-
128
-
129
-
130
-
131
 |
 |

UNITED PARCEL SERVICE, INC. AND SUBSIDIARIES
NOTES TO CONSOLIDATED FINANCIAL STATEMENTS—(Continued)
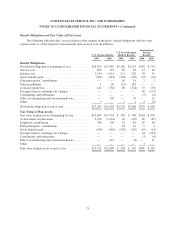
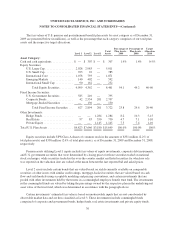
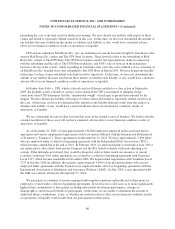
The fair values of U.S. pension and postretirement benefit plan assets by asset category as of December 31,
2009 are presented below (in millions), as well as the percentage that each category comprises of our total plan
assets and the respective target allocations.
Level 1 Level 2 Level 3
Total
Assets
Percentage of
Plan Assets -
2009
Percentage of
Plan Assets -
2008
Target
Allocation
2010
Asset Category:
Cash and cash equivalents .............. $ — $ 307 $ — $ 307 1.9% 1.4% 0-5%
Equity Securities:
U.S. Large Cap ................... 2,028 2,983 — 5,011
U.S. Small Cap ................... 763 22 — 785
International Core ................ 1,078 793 — 1,871
Emerging Markets ................ 140 402 — 542
International Small Cap ............ 90 162 — 252
Total Equity Securities ......... 4,099 4,362 — 8,461 54.1 44.2 40-60
Fixed Income Securities:
U.S. Government Securities ......... 585 210 — 795
Corporate Bonds .................. 42 2,554 201 2,797
Mortgage-Backed Securities ........ — 130 — 130
Total Fixed Income Securities . . . 627 2,894 201 3,722 23.8 29.6 20-40
Other Investments:
Hedge Funds ..................... — — 1,284 1,284 8.2 10.3 5-15
Real Estate ...................... 97 83 550 730 4.7 7.1 1-10
Private Equity .................... — — 1,145 1,145 7.3 7.4 1-10
Total U.S. Plan Assets ................. $4,823 $7,646 $3,180 $15,649 100.0% 100.0% 100%
Equity securities include UPS Class A shares of common stock in the amounts of $351 million (2.2% of
total plan assets) and $338 million (2.6% of total plan assets), as of December 31, 2009 and December 31, 2008,
respectively.
Pension assets utilizing Level 1 inputs include fair values of equity investments, corporate debt instruments,
and U.S. government securities that were determined by closing prices for those securities traded on national
stock exchanges, while securities traded in the over-the-counter market and listed securities for which no sale
was reported on the valuation date are valued at the mean between the last reported bid and asked prices.
Level 2 assets include certain bonds that are valued based on yields currently available on comparable
securities of other issues with similar credit ratings, mortgage-backed securities that are valued based on cash
flow and yield models using acceptable modeling and pricing conventions, and certain investments that are
pooled with other investments held by the trustee in a commingled employee benefit trust fund. The investments
in the commingled funds are valued by taking the percentage owned by the respective plan in the underlying net
asset value of the trust fund, which was determined in accordance with the paragraph above.
Certain investments’ estimated fair value is based on unobservable inputs that are not corroborated by
observable market data and are thus classified as Level 3. These investments include commingled funds
comprised of corporate and government bonds, hedge funds, real estate investments and private equity funds.
76