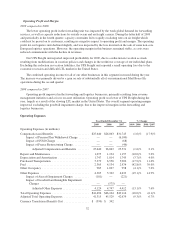
UPS 2009 Annual Report Download - page 35
Download and view the complete annual report
Please find page 35 of the 2009 UPS annual report below. You can navigate through the pages in the report by either clicking on the pages listed below, or by using the keyword search tool below to find specific information within the annual report.
Item 7. Management’s Discussion and Analysis of Financial Condition and Results of Operations
Overview
Our U.S. Domestic Package, International Package, and Supply Chain & Freight segments were all
negatively affected by the deteriorating worldwide economic situation in 2008 and 2009. Declines in world trade,
U.S. industrial production and retail sales particularly affected our package delivery, LTL and forwarding
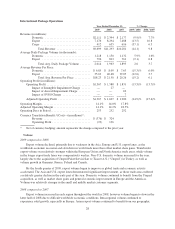
operations. Our consolidated results are presented in the table below:
Year Ended December 31, % Change
2009 2008 2007 2009 / 2008 2008 / 2007
Revenue (in millions) ............................ $45,297 $51,486 $49,692 (12.0)% 3.6%
Operating Expenses (in millions) ................... 41,496 46,104 49,114 (10.0)% (6.1)%
Operating Profit (in millions) ...................... $ 3,801 $ 5,382 $ 578 (29.4)% N/A
Operating Margin ................................ 8.4% 10.5% 1.2%
Average Daily Package Volume (in thousands) ........ 15,064 15,539 15,750 (3.1)% (1.3)%
Average Revenue Per Piece ........................ $ 9.83 $ 10.70 $ 10.24 (8.1)% 4.5%
Net Income (in millions) .......................... $ 2,152 $ 3,003 $ 382 (28.3)% N/A
Basic Earnings Per Share .......................... $ 2.16 $ 2.96 $ 0.36 (27.0)% N/A
Diluted Earnings Per Share ........................ $ 2.14 $ 2.94 $ 0.36 (27.2)% N/A
Volume and revenue trends began to improve in the latter half of 2009. Additionally, cost containment
initiatives and better network efficiencies resulted in improving operating profit trends for our small package
operations.
Items Affecting Comparability
The year-over-year comparisons of our financial results are affected by the following items (amounts in
millions):
Year Ended December 31,
2009 2008 2007
Operating Expenses:
Aircraft Impairment Charges ........................ $181 $— $ 221
Goodwill Impairment Charge ........................ — 548 —
Intangible Impairment Charge ....................... — 27 —
SVSO Charge .................................... — — 68
Pension Plan Withdrawal Charge ..................... — — 6,100
France Restructuring Charges ........................ — — 46
Interest Expense:
Currency Remeasurement Charge .................... 77 — —
Income Tax Expense (Benefit) from the Items Above ......... (94) — (2,448)
Aircraft Impairment Charges
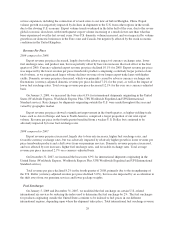
In the first quarter of 2009, we completed an impairment assessment of our McDonnell-Douglas DC-8
aircraft fleet, and recorded an impairment charge of $181 million, which affected our U.S. Domestic Package
segment. In the first quarter of 2007, we completed an impairment assessment of our Boeing 727 and 747 aircraft
fleets, and recognized an impairment charge of $221 million, of which $159 million impacted our U.S. Domestic
Package segment and $62 million impacted our International Package segment. These charges, as well as our
accounting policies pertaining to long-lived assets, are discussed further in “Critical Accounting Policies and
Estimates”.
23


