UPS 2009 Annual Report Download - page 7
Download and view the complete annual report
Please find page 7 of the 2009 UPS annual report below. You can navigate through the pages in the report by either clicking on the pages listed below, or by using the keyword search tool below to find specific information within the annual report.-
 1
1 -
 2
2 -
 3
3 -
 4
4 -
 5
5 -
 6
6 -
 7
7 -
 8
8 -
 9
9 -
 10
10 -
 11
11 -
 12
12 -
 13
13 -
 14
14 -
 15
15 -
 16
16 -
 17
17 -
 18
18 -
19
-
20
-
21
-
22
-
23
-
24
-
25
-
26
-
27
-
28
-
29
-
30
-
31
-
32
-
33
-
34
-
35
-
36
-
37
-
38
-
39
-
40
-
41
-
42
-
43
-
44
-
45
-
46
-
47
-
48
-
49
-
50
-
51
-
52
-
53
-
54
-
55
-
56
-
57
-
58
-
59
-
60
-
61
-
62
-
63
-
64
-
65
-
66
-
67
-
68
-
69
-
70
-
71
-
72
-
73
-
74
-
75
-
76
-
77
-
78
-
79
-
80
-
81
-
82
-
83
-
84
-
85
-
86
-
87
-
88
-
89
-
90
-
91
-
92
-
93
-
94
-
95
-
96
-
97
-
98
-
99
-
100
-
101
-
102
-
103
-
104
-
105
-
106
-
107
-
108
-
109
-
110
-
111
-
112
-
113
-
114
-
115
-
116
-
117
-
118
-
119
-
120
-
121
-
122
-
123
-
124
-
125
-
126
-
127
-
128
-
129
-
130
-
131
 |
 |
UP S 2 0 0 9 A n n u a l R e p o r t
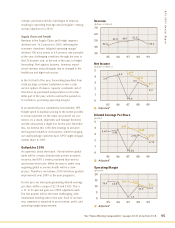
Net Income
(billions of dollars )
3
4
5
2
1
0
05 06 07 08 09
3.9
4.2
0.4
3.0
3.6
4.4
2.2
2.3
Adjusted*
Diluted Earnings Per Share
(dollars)
3
4
5
2
1
0
05 06 07 08 09
3.47 3.86
0.36
2.94
3.50
4.11
2.14
2.31
Adjusted*
Revenue
(billions of dollars)
60
70
50
40
30
05 06 07 08 09
42.6
47.5 49.7 51.5
45.3
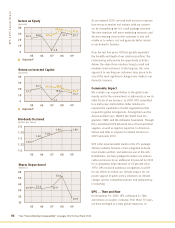
15
20
10
5
0
05 06 07 08 09
14.4 14.0
1.2
10.5
11.6
14.1
8.4
8.8
Adjusted*
Operating Margin
(percent)
*See ”Items Affecting Comparability” on pages 20-21 of our Form 10-K. 05
volumes and characteristics had begun to improve,
resulting in operating leverage and yield gains—among
our key objectives for 2010.
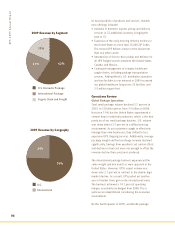
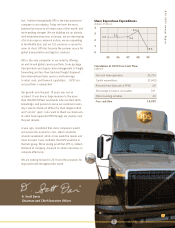
Supply Chain and Freight
Revenue in the Supply Chain and Freight segment
declined over 16.5 percent in 2009, reflecting the
economic slowdown. Adjusted operating margin*
declined 100 basis points to 4.0 percent, due primarily
to the very challenging conditions through the year in
the LTL business and, at the end of the year, in freight
forwarding. The Logistics business, however, experi-
enced revenue and profit gains due to strength in the
healthcare and high-tech sectors.
In the first half of the year, Forwarding benefited from
small package customer tradedown to less costly
service options. However, capacity constraints out of
Asia drove up purchased transportation costs in the
latter part of the year, which could not be passed on
to customers, pressuring operating margins.
In an extremely price competitive environment, UPS
Freight opted to maintain pricing to the extent possible
to ensure payment for the value we provide our cus-
tomers. As a result, shipments and tonnage declined,
and the unit posted a slight loss for the year. Neverthe-
less, we believe this is the best strategy to preserve
the long-term health of our business, while leveraging
our small package customer base. UPS Freight did gain
market share in 2009.
Outlook for 2010
I’m optimistic about the future. I firmly believe global
trade will be a major stimulus that powers economic
recovery. And UPS is better positioned than ever to
synchronize that trade. While recovery is under way,
regaining global economic health will be a slow
process. Therefore, we believe 2010 will show gradual
improvement over 2009 as the year progresses.
For the year we anticipate generating diluted earnings
per share within a range of $2.70 and $3.05. This is
a 17- to 32-percent gain over 2009 adjusted results.
The first quarter will be the most challenging, with
momentum building later in the year. Each of our busi-
ness segments is expected to post revenue, profit, and
operating margin improvement.
100235_TXT.indd 5 3/1/10 5:52 PM