UPS 2009 Annual Report Download - page 42
Download and view the complete annual report
Please find page 42 of the 2009 UPS annual report below. You can navigate through the pages in the report by either clicking on the pages listed below, or by using the keyword search tool below to find specific information within the annual report.-
 1
1 -
2
-
3
-
4
-
5
-
6
-
7
-
8
-
9
-
10
-
11
-
12
-
13
-
14
-
15
-
16
-
17
-
18
-
19
-
20
-
21
-
22
-
23
-
24
-
25
-
26
-
27
-
28
-
29
-
30
-
31
-
 32
32 -
 33
33 -
 34
34 -
 35
35 -
 36
36 -
 37
37 -
 38
38 -
 39
39 -
 40
40 -
 41
41 -
 42
42 -
 43
43 -
 44
44 -
 45
45 -
 46
46 -
 47
47 -
 48
48 -
 49
49 -
 50
50 -
 51
51 -
 52
52 -
53
-
54
-
55
-
56
-
57
-
58
-
59
-
60
-
61
-
62
-
63
-
64
-
65
-
66
-
67
-
68
-
69
-
70
-
71
-
72
-
73
-
74
-
75
-
76
-
77
-
78
-
79
-
80
-
81
-
82
-
83
-
84
-
85
-
86
-
87
-
88
-
89
-
90
-
91
-
92
-
93
-
94
-
95
-
96
-
97
-
98
-
99
-
100
-
101
-
102
-
103
-
104
-
105
-
106
-
107
-
108
-
109
-
110
-
111
-
112
-
113
-
114
-
115
-
116
-
117
-
118
-
119
-
120
-
121
-
122
-
123
-
124
-
125
-
126
-
127
-
128
-
129
-
130
-
131
 |
 |

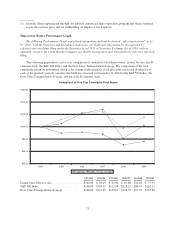
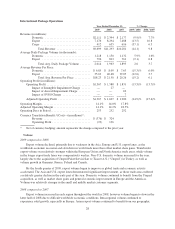
decreased by $788 million in 2009, due to lower fuel surcharge rates caused by decreased fuel prices as well as a
decrease in international air volume. Fuel surcharge revenue increased by $586 million in 2008, due to higher
fuel surcharge rates caused by increased fuel prices, as well as an increase in international air volume.
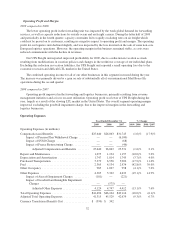
Operating Profit and Margin
2009 compared to 2008
The decline in operating profit for the year was caused primarily by a shift in product mix away from our
premium services, and volume declines in some of the longer export trade lanes. Operating profit was also
negatively impacted as we incurred a larger decline in fuel surcharge revenue compared with the decline in fuel
expense. To reduce costs, we adjusted our air network and reduced block hours and flight segments in certain
international regions. The volume trends began to improve later in the year, and in the fourth quarter operating
profit increased 19% (excluding an impairment charge in 2008), as the impact of cost initiatives and network
improvements drove an improvement in the operating margin to 16.7%.
2008 compared to 2007
The decline in operating profit and operating margin were affected by reduced asset utilization resulting
from changes in economic conditions and trade flows, such as the reduced import volume into the United States.
Operating profit and margin were also negatively affected by a shift in product mix away from our premium
services, as well as expenses associated with integration activities in our delivery network.
Because fuel costs decreased rapidly in the latter half of 2008, operating profit benefited from the
approximate two month time lag between the fuel price changes and when the monthly surcharge rates are
applied to package shipments. As a result of this time lag, fuel positively impacted the change in operating profit
during 2008, which is the opposite effect the company experienced in 2007, when fuel costs rose much faster
than the fuel surcharge rate and operating profit was adversely impacted.
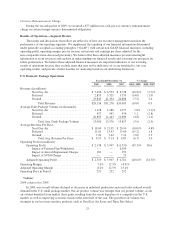
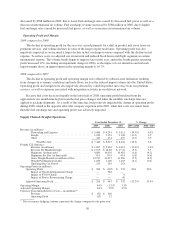
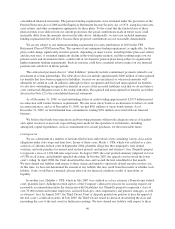
Supply Chain & Freight Operations
Year Ended December 31, % Change
2009 2008 2007 2009 / 2008 2008 / 2007
Revenue (in millions):
Forwarding and Logistics ...................... $ 5,080 $ 6,293 $ 5,911 (19.3)% 6.5%
Freight ..................................... 1,943 2,191 2,108 (11.3) 3.9
Other ...................................... 417 431 407 (3.2) 5.9
Total Revenue ........................... $ 7,440 $ 8,915 $ 8,426 (16.5) 5.8
Freight LTL Statistics:
Revenue (in millions) .......................... $ 1,807 $ 2,062 $ 2,013 (12.4)% 2.4%
Revenue Per Hundredweight .................... $ 17.69 $ 18.68 $ 17.41 (5.3) 7.3
Shipments (in thousands) ....................... 9,880 10,036 10,481 (1.6) (4.2)
Shipments Per Day (in thousands) ................ 39.1 39.5 41.4 (1.0) (4.6)
Gross Weight Hauled (in millions of lbs) .......... 10,211 11,037 11,560 (7.5) (4.5)
Weight Per Shipment (in lbs) .................... 1,033 1,100 1,103 (6.1) (0.3)
Operating Days in Period ....................... 253 254 253
Operating Profit (in millions):
Operating Profit .................................. $ 296 $ (105) $ 278 N/A N/A
Impact of Goodwill Impairment Charge ........... — 548 —
Impact of SVSO Charge ....................... — — 8
Impact of France Restructuring Charge ............ — — 46
Adjusted Operating Profit .......................... $ 296 $ 443 $ 332 (33.2)% 33.4%
Operating Margin ..................................... 4.0% (1.2)% 3.3%
Adjusted Operating Margin ............................. 4.0% 5.0% 3.9%
Currency Translation Benefit / (Cost)—(in millions)*:
Revenue .................................... $ (52) $ 166
Operating Profit .............................. (15) 12
* Net of currency hedging; amount represents the change compared to the prior year.
30