UPS 2009 Annual Report Download - page 47
Download and view the complete annual report
Please find page 47 of the 2009 UPS annual report below. You can navigate through the pages in the report by either clicking on the pages listed below, or by using the keyword search tool below to find specific information within the annual report.-
 1
1 -
2
-
3
-
4
-
5
-
6
-
7
-
8
-
9
-
10
-
11
-
12
-
13
-
14
-
15
-
16
-
17
-
18
-
19
-
20
-
21
-
22
-
23
-
24
-
25
-
26
-
27
-
28
-
29
-
30
-
31
-
32
-
33
-
34
-
35
-
36
-
 37
37 -
 38
38 -
 39
39 -
 40
40 -
 41
41 -
 42
42 -
 43
43 -
 44
44 -
 45
45 -
 46
46 -
 47
47 -
 48
48 -
 49
49 -
 50
50 -
 51
51 -
 52
52 -
 53
53 -
 54
54 -
 55
55 -
 56
56 -
 57
57 -
58
-
59
-
60
-
61
-
62
-
63
-
64
-
65
-
66
-
67
-
68
-
69
-
70
-
71
-
72
-
73
-
74
-
75
-
76
-
77
-
78
-
79
-
80
-
81
-
82
-
83
-
84
-
85
-
86
-
87
-
88
-
89
-
90
-
91
-
92
-
93
-
94
-
95
-
96
-
97
-
98
-
99
-
100
-
101
-
102
-
103
-
104
-
105
-
106
-
107
-
108
-
109
-
110
-
111
-
112
-
113
-
114
-
115
-
116
-
117
-
118
-
119
-
120
-
121
-
122
-
123
-
124
-
125
-
126
-
127
-
128
-
129
-
130
-
131
 |
 |

The 2008 increase in interest expense was largely due to a higher average balance of outstanding debt. In
early 2008, we completed the issuance of $4.0 billion in long-term debt, the proceeds of which were used to
reduce our commercial paper balance. Our commercial paper balances had previously increased to fund the
$6.1 billion Central States Pension Fund withdrawal payment in December 2007. The impact of increased debt
balances was partially mitigated, however, by lower average rates incurred on our variable rate debt and interest
rate swap agreements as a result of declines in short-term interest rates in the United States throughout 2008.
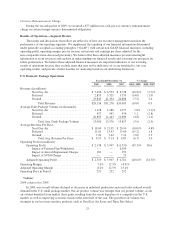
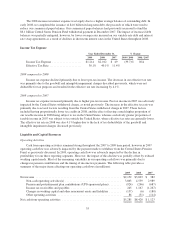
Income Tax Expense
Year Ended December 31, % Change
2009 2008 2007 2009 / 2008 2008 / 2007
Income Tax Expense .................... $1,214 $2,012 $ 49 (39.7)% N/A
Effective Tax Rate ...................... 36.1% 40.1% 11.4%
2009 compared to 2008
Income tax expense declined primarily due to lower pre-tax income. The decrease in our effective tax rate
was primarily due to the goodwill and intangible impairment charges described previously, which were not
deductible for tax purposes and resulted in the effective tax rate increasing by 4.1%.
2008 compared to 2007
Income tax expense increased primarily due to higher pre-tax income. Pre-tax income in 2007 was adversely
impacted by the Central States withdrawal charge, as noted previously. The increase in the effective tax rate was
primarily due to several factors resulting from the Central States withdrawal charge in 2007. These factors
included having proportionally lower tax credits in 2008, and the effect of having a much higher proportion of
our taxable income in 2008 being subject to tax in the United States, whereas a relatively greater proportion of
taxable income in 2007 was subject to tax outside the United States, where effective tax rates are generally lower.
The effective tax rate in 2008 was also 4.1% higher due to the lack of tax deductibility of the goodwill and
intangible impairment charges discussed previously.
Liquidity and Capital Resources
Operating Activities
Cash from operating activities remained strong throughout the 2007 to 2009 time period, however in 2007
operating cash flow was adversely impacted by the payment made to withdraw from the Central States Pension
Fund, as previously discussed. In 2009, operating cash flow was adversely impacted by the decline in
profitability for our three reporting segments. However, the impact of this decline was partially offset by reduced
working capital needs. Most of the remaining variability in our operating cash flows was primarily due to
changes in pension contributions and the timing of income tax payments. The following table provides a
summary of the major items affecting our operating cash flows (in millions):
2009 2008 2007
Net income .......................................................... $2,152 $3,003 $ 382
Non-cash operating activities(a) ...................................... 3,863 4,539 2,989
Pension and postretirement plan contributions (UPS-sponsored plans) ........ (924) (246) (687)
Income tax receivables and payables .................................. 245 1,167 (1,267)
Changes in working capital and other noncurrent assets and liabilities ........ (137) (6) (180)
Other operating activities ........................................... 86 (31) (114)
Net cash from operating activities ........................................ $5,285 $8,426 $ 1,123
35