UPS 2009 Annual Report Download - page 74
Download and view the complete annual report
Please find page 74 of the 2009 UPS annual report below. You can navigate through the pages in the report by either clicking on the pages listed below, or by using the keyword search tool below to find specific information within the annual report.-
 1
1 -
2
-
3
-
4
-
5
-
6
-
7
-
8
-
9
-
10
-
11
-
12
-
13
-
14
-
15
-
16
-
17
-
18
-
19
-
20
-
21
-
22
-
23
-
24
-
25
-
26
-
27
-
28
-
29
-
30
-
31
-
32
-
33
-
34
-
35
-
36
-
37
-
38
-
39
-
40
-
41
-
42
-
43
-
44
-
45
-
46
-
47
-
48
-
49
-
50
-
51
-
52
-
53
-
54
-
55
-
56
-
57
-
58
-
59
-
60
-
61
-
62
-
63
-
 64
64 -
 65
65 -
 66
66 -
 67
67 -
 68
68 -
 69
69 -
 70
70 -
 71
71 -
 72
72 -
 73
73 -
 74
74 -
 75
75 -
 76
76 -
 77
77 -
 78
78 -
 79
79 -
 80
80 -
 81
81 -
 82
82 -
 83
83 -
 84
84 -
85
-
86
-
87
-
88
-
89
-
90
-
91
-
92
-
93
-
94
-
95
-
96
-
97
-
98
-
99
-
100
-
101
-
102
-
103
-
104
-
105
-
106
-
107
-
108
-
109
-
110
-
111
-
112
-
113
-
114
-
115
-
116
-
117
-
118
-
119
-
120
-
121
-
122
-
123
-
124
-
125
-
126
-
127
-
128
-
129
-
130
-
131
 |
 |

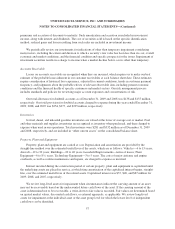
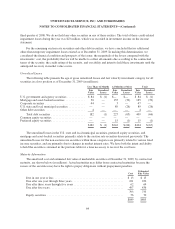
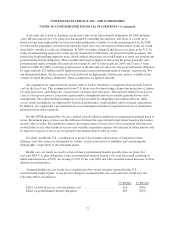
UNITED PARCEL SERVICE, INC. AND SUBSIDIARIES
NOTES TO CONSOLIDATED FINANCIAL STATEMENTS—(Continued)
NOTE 2. CASH AND INVESTMENTS
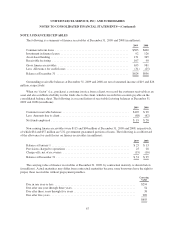
The following is a summary of marketable securities classified as available-for-sale at December 31, 2009
and 2008 (in millions):
Cost
Unrealized
Gains
Unrealized
Losses
Estimated
Fair Value
2009
Current marketable securities:
U.S. government and agency debt securities ................. $126 $— $ (1) $125
Mortgage and asset-backed debt securities ................... 158 2 (1) 159
Corporate debt securities ................................ 213 6 — 219
U.S. state and local municipal debt securities ................ 22 — — 22
Other debt and equity securities ........................... 28 5 — 33
Current marketable securities ................................. 547 13 (2) 558
Non-current marketable securities:
Mortgage and asset-backed debt securities ................... 150 — (38) 112
U.S. state and local municipal debt securities ................ 115 — (26) 89
Common equity securities ............................... 21 10 — 31
Preferred equity securities ............................... 16 — (1) 15
Non-current marketable securities ............................. 302 10 (65) 247
Total marketable securities ................................... $849 $ 23 $ (67) $805
Cost
Unrealized
Gains
Unrealized
Losses
Estimated
Fair Value
2008
Current marketable securities:
U.S. government and agency debt securities ................. $ 93 $ 2 $— $ 95
Mortgage and asset-backed debt securities ................... 278 3 (11) 270
Corporate debt securities ................................ 158 5 (3) 160
Other debt and equity securities ........................... 30 — (13) 17
Current marketable securities ................................. 559 10 (27) 542
Non-current marketable securities:
Mortgage and asset-backed debt securities ................... 150 — (34) 116
U.S. state and local municipal debt securities ................ 116 — (29) 87
Common equity securities ............................... 25 3 — 28
Preferred equity securities ............................... 21 — (8) 13
Non-current marketable securities ............................. 312 3 (71) 244
Total marketable securities ................................... $871 $ 13 $ (98) $786
The gross realized gains on sales of marketable securities totaled $16, $19, and $23 million in 2009, 2008,
and 2007, respectively. The gross realized losses totaled $12, $10, and $9 million in 2009, 2008, and 2007,
respectively. Impairment losses recognized on marketable securities and short-term investments totaled $17 and
$23 million during 2009 and 2008 (discussed further below), with no such losses recognized in 2007.
62