UPS 2009 Annual Report Download - page 40
Download and view the complete annual report
Please find page 40 of the 2009 UPS annual report below. You can navigate through the pages in the report by either clicking on the pages listed below, or by using the keyword search tool below to find specific information within the annual report.-
 1
1 -
2
-
3
-
4
-
5
-
6
-
7
-
8
-
9
-
10
-
11
-
12
-
13
-
14
-
15
-
16
-
17
-
18
-
19
-
20
-
21
-
22
-
23
-
24
-
25
-
26
-
27
-
28
-
29
-
 30
30 -
 31
31 -
 32
32 -
 33
33 -
 34
34 -
 35
35 -
 36
36 -
 37
37 -
 38
38 -
 39
39 -
 40
40 -
 41
41 -
 42
42 -
 43
43 -
 44
44 -
 45
45 -
 46
46 -
 47
47 -
 48
48 -
 49
49 -
 50
50 -
51
-
52
-
53
-
54
-
55
-
56
-
57
-
58
-
59
-
60
-
61
-
62
-
63
-
64
-
65
-
66
-
67
-
68
-
69
-
70
-
71
-
72
-
73
-
74
-
75
-
76
-
77
-
78
-
79
-
80
-
81
-
82
-
83
-
84
-
85
-
86
-
87
-
88
-
89
-
90
-
91
-
92
-
93
-
94
-
95
-
96
-
97
-
98
-
99
-
100
-
101
-
102
-
103
-
104
-
105
-
106
-
107
-
108
-
109
-
110
-
111
-
112
-
113
-
114
-
115
-
116
-
117
-
118
-
119
-
120
-
121
-
122
-
123
-
124
-
125
-
126
-
127
-
128
-
129
-
130
-
131
 |
 |

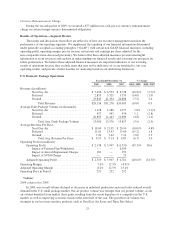
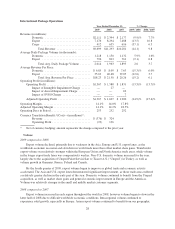
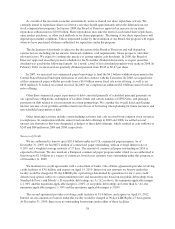
International Package Operations
Year Ended December 31, % Change
2009 2008 2007 2009 / 2008 2008 / 2007
Revenue (in millions):
Domestic ............................... $2,111 $ 2,344 $ 2,177 (9.9)% 7.7%
Export ................................. 7,176 8,294 7,488 (13.5) 10.8
Cargo .................................. 412 655 616 (37.1) 6.3
Total Revenue ....................... $9,699 $11,293 $10,281 (14.1) 9.8
Average Daily Package Volume (in thousands):
Domestic ............................... 1,218 1,150 1,132 5.9% 1.6%
Export ................................. 796 813 761 (2.1) 6.8
Total Avg. Daily Package Volume ....... 2,014 1,963 1,893 2.6 3.7
Average Revenue Per Piece:
Domestic ............................... $ 6.85 $ 8.09 $ 7.63 (15.3)% 6.0%
Export ................................. 35.63 40.48 39.05 (12.0) 3.7
Total Avg. Revenue Per Piece ........... $18.23 $ 21.50 $ 20.26 (15.2) 6.1
Operating Profit (in millions):
Operating Profit .............................. $1,367 $ 1,580 $ 1,831 (13.5)% (13.7)%
Impact of Intangible Impairment Charge ...... — 27 —
Impact of Aircraft Impairment Charge ........ — — 62
Impact of SVSO Charge ................... — — 7
Adjusted Operating Profit ...................... $1,367 $ 1,607 $ 1,900 (14.9)% (15.4)%
Operating Margin ................................. 14.1% 14.0% 17.8%
Adjusted Operating Margin ......................... 14.1% 14.2% 18.5%
Operating Days in Period ........................... 253 252 252
Currency Translation Benefit / (Cost)—(in millions)*:
Revenue ................................ $ (376) $ 324
Operating Profit .......................... (23) 136
* Net of currency hedging; amount represents the change compared to the prior year.
Volume
2009 compared to 2008
Export volume declined, primarily due to weakness in the Asia, Europe and U.S. export lanes, as the
worldwide economic recession and slowdown in world trade more than offset market share gains. Transborder
export volume was relatively stronger within the European Union and North America trade areas, while volume
in the longer export trade lanes was comparatively weaker. Non-U.S. domestic volume increased for the year,
largely due to the acquisition of Unsped Paket Servisi San ve Ticaret A.S. (“Unsped”) in Turkey, as well as
volume growth in Germany, France, Poland and Canada.
By the fourth quarter of 2009, export volume began to improve as global trade and economic activity
accelerated. The Asia and U.S. export lanes demonstrated significant improvement, as those trade areas suffered
a relatively greater decline in the early part of the year. Domestic volume continued to benefit from the Unsped
acquisition, as well as market share gains and general economic improvement in Europe and the Americas.
Volume was relatively stronger in the small and middle market customer segments.
2008 compared to 2007
Export volume increased in each region throughout the world in 2008, however volume began to slow in the
latter half of 2008 due to difficult worldwide economic conditions. Intra-regional volume continued to
experience solid growth, especially in Europe. Asian export volume continued to benefit from our geographic
28