UPS 2009 Annual Report Download - page 76
Download and view the complete annual report
Please find page 76 of the 2009 UPS annual report below. You can navigate through the pages in the report by either clicking on the pages listed below, or by using the keyword search tool below to find specific information within the annual report.-
 1
1 -
2
-
3
-
4
-
5
-
6
-
7
-
8
-
9
-
10
-
11
-
12
-
13
-
14
-
15
-
16
-
17
-
18
-
19
-
20
-
21
-
22
-
23
-
24
-
25
-
26
-
27
-
28
-
29
-
30
-
31
-
32
-
33
-
34
-
35
-
36
-
37
-
38
-
39
-
40
-
41
-
42
-
43
-
44
-
45
-
46
-
47
-
48
-
49
-
50
-
51
-
52
-
53
-
54
-
55
-
56
-
57
-
58
-
59
-
60
-
61
-
62
-
63
-
64
-
65
-
 66
66 -
 67
67 -
 68
68 -
 69
69 -
 70
70 -
 71
71 -
 72
72 -
 73
73 -
 74
74 -
 75
75 -
 76
76 -
 77
77 -
 78
78 -
 79
79 -
 80
80 -
 81
81 -
 82
82 -
 83
83 -
 84
84 -
 85
85 -
 86
86 -
87
-
88
-
89
-
90
-
91
-
92
-
93
-
94
-
95
-
96
-
97
-
98
-
99
-
100
-
101
-
102
-
103
-
104
-
105
-
106
-
107
-
108
-
109
-
110
-
111
-
112
-
113
-
114
-
115
-
116
-
117
-
118
-
119
-
120
-
121
-
122
-
123
-
124
-
125
-
126
-
127
-
128
-
129
-
130
-
131
 |
 |

UNITED PARCEL SERVICE, INC. AND SUBSIDIARIES
NOTES TO CONSOLIDATED FINANCIAL STATEMENTS—(Continued)
third quarter of 2008. We do not hold any other securities in any of these entities. The total of these credit-related
impairment losses during the year was $23 million, which was recorded in investment income on the income
statement.
For the remaining auction rate securities and other debt securities, we have concluded that no additional
other-than-temporary impairment losses existed as of December 31, 2009. In making this determination, we
considered the financial condition and prospects of the issuer, the magnitude of the losses compared with the
investments’ cost, the probability that we will be unable to collect all amounts due according to the contractual
terms of the security, the credit rating of the security, and our ability and intent to hold these investments until the
anticipated recovery in market value occurs.
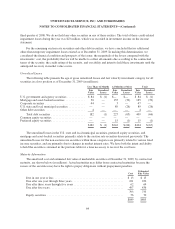
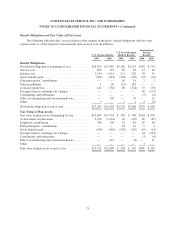
Unrealized Losses
The following table presents the age of gross unrealized losses and fair value by investment category for all
securities in a loss position as of December 31, 2009 (in millions):
Less Than 12 Months 12 Months or More Total
Fair
Value
Unrealized
Losses
Fair
Value
Unrealized
Losses
Fair
Value
Unrealized
Losses
U.S. government and agency securities ............ $ 84 $ (1) $— $— $ 84 $ (1)
Mortgage and asset-backed securities ............. 50 — 135 (39) 185 (39)
Corporate securities ........................... 44 — 3 — 47 —
U.S. state and local municipal securities ........... — — 89 (26) 89 (26)
Other debt securities .......................... 4 — — — 4 —
Total debt securities ....................... 182 (1) 227 (65) 409 (66)
Common equity securities ...................... — — ————
Preferred equity securities ...................... — — 15 (1) 15 (1)
$182 $ (1) $242 $ (66) $424 $ (67)
The unrealized losses in the U.S. state and local municipal securities, preferred equity securities, and
mortgage and asset-backed securities primarily relate to the auction rate securities discussed previously. The
unrealized losses for the non-auction rate securities within those categories are primarily related to various fixed
income securities, and are primarily due to changes in market interest rates. We have both the intent and ability
to hold the securities contained in the previous table for a time necessary to recover the cost basis.
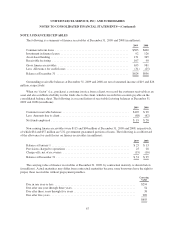
Maturity Information
The amortized cost and estimated fair value of marketable securities at December 31, 2009, by contractual
maturity, are shown below (in millions). Actual maturities may differ from contractual maturities because the
issuers of the securities may have the right to prepay obligations without prepayment penalties.
Cost
Estimated
Fair Value
Due in one year or less ............................................... $ 13 $ 13
Due after one year through three years ................................... 221 222
Due after three years through five years .................................. 62 64
Due after five years .................................................. 497 436
793 735
Equity securities .................................................... 56 70
$849 $805
64