UPS 2009 Annual Report Download - page 37
Download and view the complete annual report
Please find page 37 of the 2009 UPS annual report below. You can navigate through the pages in the report by either clicking on the pages listed below, or by using the keyword search tool below to find specific information within the annual report.-
 1
1 -
2
-
3
-
4
-
5
-
6
-
7
-
8
-
9
-
10
-
11
-
12
-
13
-
14
-
15
-
16
-
17
-
18
-
19
-
20
-
21
-
22
-
23
-
24
-
25
-
26
-
 27
27 -
 28
28 -
 29
29 -
 30
30 -
 31
31 -
 32
32 -
 33
33 -
 34
34 -
 35
35 -
 36
36 -
 37
37 -
 38
38 -
 39
39 -
 40
40 -
 41
41 -
 42
42 -
 43
43 -
 44
44 -
 45
45 -
 46
46 -
 47
47 -
48
-
49
-
50
-
51
-
52
-
53
-
54
-
55
-
56
-
57
-
58
-
59
-
60
-
61
-
62
-
63
-
64
-
65
-
66
-
67
-
68
-
69
-
70
-
71
-
72
-
73
-
74
-
75
-
76
-
77
-
78
-
79
-
80
-
81
-
82
-
83
-
84
-
85
-
86
-
87
-
88
-
89
-
90
-
91
-
92
-
93
-
94
-
95
-
96
-
97
-
98
-
99
-
100
-
101
-
102
-
103
-
104
-
105
-
106
-
107
-
108
-
109
-
110
-
111
-
112
-
113
-
114
-
115
-
116
-
117
-
118
-
119
-
120
-
121
-
122
-
123
-
124
-
125
-
126
-
127
-
128
-
129
-
130
-
131
 |
 |

Currency Remeasurement Charge
During the second quarter of 2009, we incurred a $77 million non-cash, pre-tax currency remeasurement
charge on certain foreign currency denominated obligations.
Results of Operations—Segment Review
The results and discussions that follow are reflective of how our executive management monitors the
performance of our reporting segments. We supplement the reporting of our financial information determined
under generally accepted accounting principles (“GAAP”) with certain non-GAAP financial measures, including
operating profit, operating margin, pre-tax income, net income and earnings per share adjusted for the
non-comparable items discussed previously. We believe that these adjusted measures provide meaningful
information to assist investors and analysts in understanding our financial results and assessing our prospects for
future performance. We believe these adjusted financial measures are important indicators of our recurring
results of operations because they exclude items that may not be indicative of, or are unrelated to, our core
operating results, and provide a better baseline for analyzing trends in our underlying businesses.
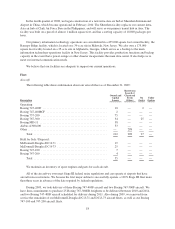
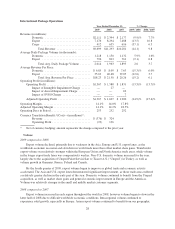
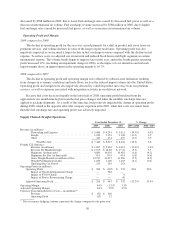
U.S. Domestic Package Operations
Year Ended December 31, % Change
2009 2008 2007 2009 / 2008 2008 / 2007
Revenue (in millions):
Next Day Air ........................... $ 5,456 $ 6,559 $ 6,738 (16.8)% (2.7)%
Deferred ............................... 2,859 3,325 3,359 (14.0) (1.0)
Ground ................................ 19,843 21,394 20,888 (7.2) 2.4
Total Revenue ...................... $28,158 $31,278 $30,985 (10.0) 0.9
Average Daily Package Volume (in thousands):
Next Day Air ........................... 1,198 1,186 1,277 1.0% (7.1)%
Deferred ............................... 957 947 974 1.1 (2.8)
Ground ................................ 10,895 11,443 11,606 (4.8) (1.4)
Total Avg. Daily Package Volume ...... 13,050 13,576 13,857 (3.9) (2.0)
Average Revenue Per Piece:
Next Day Air ........................... $ 18.00 $ 21.95 $ 20.94 (18.0)% 4.8%
Deferred ............................... 11.81 13.93 13.69 (15.2) 1.8
Ground ................................ 7.20 7.42 7.14 (3.0) 3.9
Total Avg. Revenue Per Piece .......... $ 8.53 $ 9.14 $ 8.87 (6.7) 3.0
Operating Profit (in millions):
Operating Profit ............................. $ 2,138 $ 3,907 $ (1,531) (45.3)% N/A
Impact of Pension Plan Withdrawal ......... — — 6,100
Impact of Aircraft Impairment Charges ...... 181 — 159
Impact of SVSO Charge .................. — — 53
Adjusted Operating Profit ..................... $ 2,319 $ 3,907 $ 4,781 (40.6)% (18.3)%
Operating Margin ................................ 7.6% 12.5% (4.9)%
Adjusted Operating Margin ........................ 8.2% 12.5% 15.4%
Operating Days in Period .......................... 253 252 252
Volume:
2009 compared to 2008
In 2009, our overall volume declined as decreases in industrial production and retail sales reduced overall
demand in the U.S. small package market. Our air product volume was stronger than our ground volume, as our
air volume benefited from market share gains resulting from the recent departure of a competitor in the U.S.
market, as well as improving economic trends in the latter half of the year. The growth in air volume was
strongest in our less time-sensitive products, such as Next Day Air Saver and Three Day Select.
25