UPS 2009 Annual Report Download - page 6
Download and view the complete annual report
Please find page 6 of the 2009 UPS annual report below. You can navigate through the pages in the report by either clicking on the pages listed below, or by using the keyword search tool below to find specific information within the annual report.-
 1
1 -
 2
2 -
 3
3 -
 4
4 -
 5
5 -
 6
6 -
 7
7 -
 8
8 -
 9
9 -
 10
10 -
 11
11 -
 12
12 -
 13
13 -
 14
14 -
 15
15 -
 16
16 -
 17
17 -
18
-
19
-
20
-
21
-
22
-
23
-
24
-
25
-
26
-
27
-
28
-
29
-
30
-
31
-
32
-
33
-
34
-
35
-
36
-
37
-
38
-
39
-
40
-
41
-
42
-
43
-
44
-
45
-
46
-
47
-
48
-
49
-
50
-
51
-
52
-
53
-
54
-
55
-
56
-
57
-
58
-
59
-
60
-
61
-
62
-
63
-
64
-
65
-
66
-
67
-
68
-
69
-
70
-
71
-
72
-
73
-
74
-
75
-
76
-
77
-
78
-
79
-
80
-
81
-
82
-
83
-
84
-
85
-
86
-
87
-
88
-
89
-
90
-
91
-
92
-
93
-
94
-
95
-
96
-
97
-
98
-
99
-
100
-
101
-
102
-
103
-
104
-
105
-
106
-
107
-
108
-
109
-
110
-
111
-
112
-
113
-
114
-
115
-
116
-
117
-
118
-
119
-
120
-
121
-
122
-
123
-
124
-
125
-
126
-
127
-
128
-
129
-
130
-
131
 |
 |

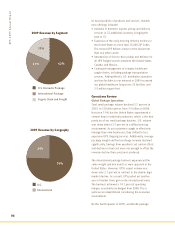
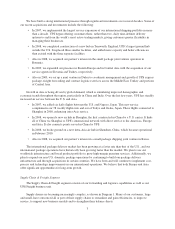
2009 Revenue by Geography
U.S.
International
76%
24%
UP S 2 0 0 9 A n n u a l R e p o r t
2009 Revenue by Segment
U.S. Domestic Package
International Package
Supply Chain and Freight
62%
17%
21%
04
its broad portfolio of products and services. Notable
new offerings included:
Initiation of domestic express pickup and delivery
services in 22 additional countries, bringing the
total to 55.
Expansion of the early morning delivery territory in
the United States to more than 23,000 ZIP Codes.
This means UPS delivers early to more businesses
than any other carrier.
Introduction of door-to-door pickup and delivery for
all UPS Freight services between the United States,
Canada, and Mexico.
Continued management of complex healthcare
supply chains, including package transportation
services. Adding Merck’s U.S. distribution operation
and two facilities to our network in 2009 increased
our global healthcare footprint to 25 facilities and
3.5 million square feet.
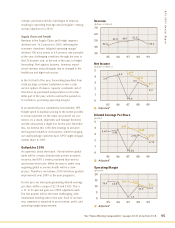
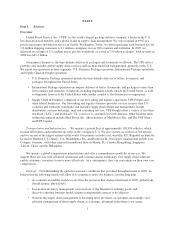
Operations Review
Global Package Operations
Total small package volume declined 2.7 percent in
2009, to 3.8 billion pieces from 3.9 billion in 2008.
Not since 1946 has the United States experienced a
steeper drop in industrial production, which is the best
predictor of our small package business. U.S. volume
was down almost 3.9 percent in a difficult pricing
environment. As our customers sought to effectively
manage their own businesses, they shifted to less
expensive UPS shipping services. Additionally, average
package weight and fuel surcharge revenue declined
significantly. Savings from excellent cost control efforts
and declines in fuel cost were not enough to offset the
revenue decline these pressures produced.
The international package business experienced the
same weight and mix trends as were apparent in the
United States. However, UPS’s export volume was
down only 2.1 percent in contrast to the double-digit
market decline. As a result, UPS posted yet another
year of market share gain in the international arena.
The business achieved a 14.1 percent operating
margin, essentially unchanged from 2008. This is
quite an accomplishment considering the economic
environment.
By the fourth quarter of 2009, worldwide package
100235_TXT.indd 4 3/1/10 5:52 PM