UPS 2005 Annual Report Download - page 91
Download and view the complete annual report
Please find page 91 of the 2005 UPS annual report below. You can navigate through the pages in the report by either clicking on the pages listed below, or by using the keyword search tool below to find specific information within the annual report.-
 1
1 -
2
-
3
-
4
-
5
-
6
-
7
-
8
-
9
-
10
-
11
-
12
-
13
-
14
-
15
-
16
-
17
-
18
-
19
-
20
-
21
-
22
-
23
-
24
-
25
-
26
-
27
-
28
-
29
-
30
-
31
-
32
-
33
-
34
-
35
-
36
-
37
-
38
-
39
-
40
-
41
-
42
-
43
-
44
-
45
-
46
-
47
-
48
-
49
-
50
-
51
-
52
-
53
-
54
-
55
-
56
-
57
-
58
-
59
-
60
-
61
-
62
-
63
-
64
-
65
-
66
-
67
-
68
-
69
-
70
-
71
-
72
-
73
-
74
-
75
-
76
-
77
-
78
-
79
-
80
-
 81
81 -
 82
82 -
 83
83 -
 84
84 -
 85
85 -
 86
86 -
 87
87 -
 88
88 -
 89
89 -
 90
90 -
 91
91 -
 92
92 -
 93
93 -
 94
94 -
 95
95 -
 96
96 -
 97
97 -
 98
98 -
 99
99 -
 100
100 -
 101
101 -
102
-
103
-
104
 |
 |

UNITED PARCEL SERVICE, INC. AND SUBSIDIARIES
NOTES TO CONSOLIDATED FINANCIAL STATEMENTS—(Continued)
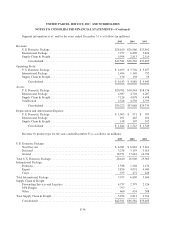
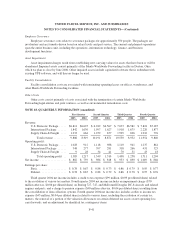
Geographic information as of, and for the years ended, December 31 is as follows (in millions):
2005 2004 2003
United States:
Revenue ...................................................... $31,871 $28,035 $26,968
Long-lived assets ............................................... $19,704 $16,033 $15,634
International:
Revenue ...................................................... $10,710 $ 8,547 $ 6,517
Long-lived assets ............................................... $ 4,044 $ 3,975 $ 3,567
Consolidated:
Revenue ...................................................... $42,581 $36,582 $33,485
Long-lived assets ............................................... $23,748 $20,008 $19,201
Revenue, for geographic disclosure, is based on the location in which service originates. Long-lived assets
include property, plant and equipment, prepaid pension costs, long-term investments, goodwill, and intangible
assets.
NOTE 13. OTHER OPERATING EXPENSES
The major components of other operating expenses for the years ended December 31 are as follows (in
millions):
2005 2004 2003
Repairs and maintenance .............................................. $ 1,097 $ 1,005 $ 955
Depreciation and amortization .......................................... 1,644 1,543 1,549
Purchased transportation .............................................. 4,050 2,059 1,828
Fuel............................................................... 2,085 1,416 1,050
Otheroccupancy..................................................... 872 752 730
Otherexpenses ...................................................... 4,173 3,995 3,677
$13,921 $10,770 $9,789
In 2005, we reclassified certain amounts between “other expenses” and “compensation and benefits”
expense, related to the capitalization of internally-developed software. Amounts were also reclassified in all prior
periods for consistent presentation in our consolidated income statement. The reclassification had the effect of
increasing other expenses, and reducing compensation and benefits expense, by $92, $93, and $77 million in
2005, 2004, and 2003, respectively.
F-35