UPS 2005 Annual Report Download - page 78
Download and view the complete annual report
Please find page 78 of the 2005 UPS annual report below. You can navigate through the pages in the report by either clicking on the pages listed below, or by using the keyword search tool below to find specific information within the annual report.-
 1
1 -
2
-
3
-
4
-
5
-
6
-
7
-
8
-
9
-
10
-
11
-
12
-
13
-
14
-
15
-
16
-
17
-
18
-
19
-
20
-
21
-
22
-
23
-
24
-
25
-
26
-
27
-
28
-
29
-
30
-
31
-
32
-
33
-
34
-
35
-
36
-
37
-
38
-
39
-
40
-
41
-
42
-
43
-
44
-
45
-
46
-
47
-
48
-
49
-
50
-
51
-
52
-
53
-
54
-
55
-
56
-
57
-
58
-
59
-
60
-
61
-
62
-
63
-
64
-
65
-
66
-
67
-
 68
68 -
 69
69 -
 70
70 -
 71
71 -
 72
72 -
 73
73 -
 74
74 -
 75
75 -
 76
76 -
 77
77 -
 78
78 -
 79
79 -
 80
80 -
 81
81 -
 82
82 -
 83
83 -
 84
84 -
 85
85 -
 86
86 -
 87
87 -
 88
88 -
89
-
90
-
91
-
92
-
93
-
94
-
95
-
96
-
97
-
98
-
99
-
100
-
101
-
102
-
103
-
104
 |
 |

UNITED PARCEL SERVICE, INC. AND SUBSIDIARIES
NOTES TO CONSOLIDATED FINANCIAL STATEMENTS—(Continued)
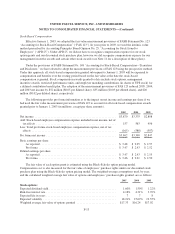
and 2004, respectively, were recorded as a reduction of other comprehensive income in shareowners’ equity (net
of the tax effect of $54 and $46 million, respectively).
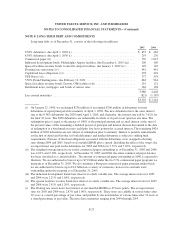
Plan Assets
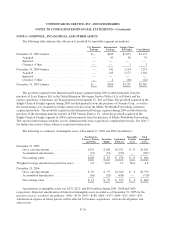
The following table provides a reconciliation of the changes in the pension and postretirement medical
benefit plan assets as of September 30 (in millions):
Pension Benefits
Postretirement
Medical Benefits
2005 2004 2005 2004
Fair value of plan assets at October 1, prior year .................. $10,094 $ 7,933 $ 455 $ 409
Actual return on plan assets ................................... 1,499 1,139 62 51
Employercontributions ...................................... 864 1,216 131 115
Plan participants’ contributions ................................ 1 1 10 9
Acquired businesses ........................................ 1,012 — — —
Foreign currency exchange rate changes ......................... (7) 10 — —
Settlements ................................................ (5) — — —
Gross benefits paid ......................................... (249) (205) (149) (129)
Fair value of plan assets at September 30 ........................ $13,209 $10,094 $ 509 $ 455
Employer contributions and benefits paid under the pension plans include $9 and $8 million paid from
employer assets in 2005 and 2004, respectively. Employer contributions and benefits paid (net of participant
contributions) under the postretirement medical benefit plans include $69 and $57 million paid from employer
assets in 2005 and 2004, respectively.
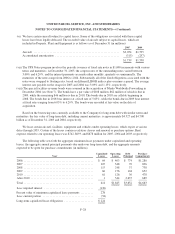
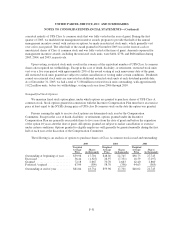
The asset allocation for our U.S. pension and other postretirement plans as of September 30, 2005 and 2004
and the target allocation for 2006, by asset category, are as follows:
Weighted Average
Target Allocation
2006
Percentage of
Plan Assets at
September 30,
2005 2004
Equity securities ....................................... 55%-65% 62.1% 60.6%
Fixed income securities ................................. 20%-30% 25.9% 28.0%
Real estate / other ...................................... 10%-15% 12.0% 11.4%
Total ................................................ 100.0% 100.0%
Equity securities include UPS Class A shares of common stock in the amounts of $423 (3.4% of total plan
assets) and $466 million (4.5% of total plan assets), as of September 30, 2005 and 2004, respectively.
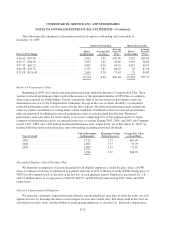
The applicable benefit plan committees establish investment guidelines and strategies, and regularly monitor
the performance of the funds and portfolio managers. Our investment strategy with respect to pension assets is to
invest the assets in accordance with applicable laws and regulations. The long-term primary objectives for our
pension assets are to (1) provide for a reasonable amount of long-term growth of capital, without undue exposure
to risk; and protect the assets from erosion of purchasing power, and (2) provide investment results that meet or
exceed the plans’ actuarially assumed long-term rate of return.
F-22