UPS 2005 Annual Report Download - page 71
Download and view the complete annual report
Please find page 71 of the 2005 UPS annual report below. You can navigate through the pages in the report by either clicking on the pages listed below, or by using the keyword search tool below to find specific information within the annual report.-
 1
1 -
2
-
3
-
4
-
5
-
6
-
7
-
8
-
9
-
10
-
11
-
12
-
13
-
14
-
15
-
16
-
17
-
18
-
19
-
20
-
21
-
22
-
23
-
24
-
25
-
26
-
27
-
28
-
29
-
30
-
31
-
32
-
33
-
34
-
35
-
36
-
37
-
38
-
39
-
40
-
41
-
42
-
43
-
44
-
45
-
46
-
47
-
48
-
49
-
50
-
51
-
52
-
53
-
54
-
55
-
56
-
57
-
58
-
59
-
60
-
 61
61 -
 62
62 -
 63
63 -
 64
64 -
 65
65 -
 66
66 -
 67
67 -
 68
68 -
 69
69 -
 70
70 -
 71
71 -
 72
72 -
 73
73 -
 74
74 -
 75
75 -
 76
76 -
 77
77 -
 78
78 -
 79
79 -
 80
80 -
 81
81 -
82
-
83
-
84
-
85
-
86
-
87
-
88
-
89
-
90
-
91
-
92
-
93
-
94
-
95
-
96
-
97
-
98
-
99
-
100
-
101
-
102
-
103
-
104
 |
 |

UNITED PARCEL SERVICE, INC. AND SUBSIDIARIES
NOTES TO CONSOLIDATED FINANCIAL STATEMENTS—(Continued)
date to the date retirement eligibility is achieved, if that is expected to occur during the nominal vesting period.
We will continue to apply the nominal vesting period approach for any awards granted prior to January 1, 2006,
and for the remaining portion of the then unvested outstanding awards.
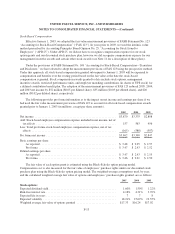
If we had accounted for all share-based compensation awards granted prior to January 1, 2006 under the
non-substantive vesting period approach, the impact to our net income and earnings per share would have been
immaterial for all prior periods. The adoption of the non-substantive vesting period approach is expected to
reduce 2006 net income by an estimated $29 million, or $0.03 per diluted share, based on share-based awards
that we are anticipating granting in 2006.
The adoption of the following recent accounting pronouncements did not have a material impact on our
results of operations or financial condition:
• FASB Interpretation No. 47, “Accounting for Conditional Asset Retirement Obligations”;
• EITF 05-6, “Determining the Amortization Period for Leasehold Improvements”; and
• FASB Statement No. 150, “Accounting for Certain Instruments with Characteristics of Both Liabilities
and Equity”.
Changes in Presentation
Certain prior year amounts have been reclassified to conform to the current year presentation.
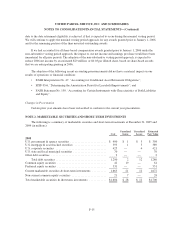
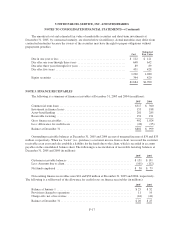
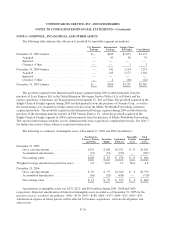
NOTE 2. MARKETABLE SECURITIES AND SHORT-TERM INVESTMENTS
The following is a summary of marketable securities and short-term investments at December 31, 2005 and
2004 (in millions):
Cost
Unrealized
Gains
Unrealized
Losses
Estimated
Fair Value
2005
U.S. government & agency securities ......................... $ 400 $ 1 $ 3 $ 398
U.S. mortgage & asset-backed securities ...................... 393 1 5 389
U.S. corporate securities ................................... 425 — 4 421
U.S. state and local municipal securities ....................... 70 — — 70
Other debt securities ...................................... 2 — — 2
Total debt securities ................................... 1,290 2 12 1,280
Common equity securities .................................. 42 19 — 61
Preferred equity securities .................................. 331 — — 331
Current marketable securities & short-term investments .......... 1,663 21 12 1,672
Non-current common equity securities ........................ 21 7 — 28
Total marketable securities & short-term investments ............ $1,684 $ 28 $ 12 $1,700
F-15