UPS 2005 Annual Report Download - page 12
Download and view the complete annual report
Please find page 12 of the 2005 UPS annual report below. You can navigate through the pages in the report by either clicking on the pages listed below, or by using the keyword search tool below to find specific information within the annual report.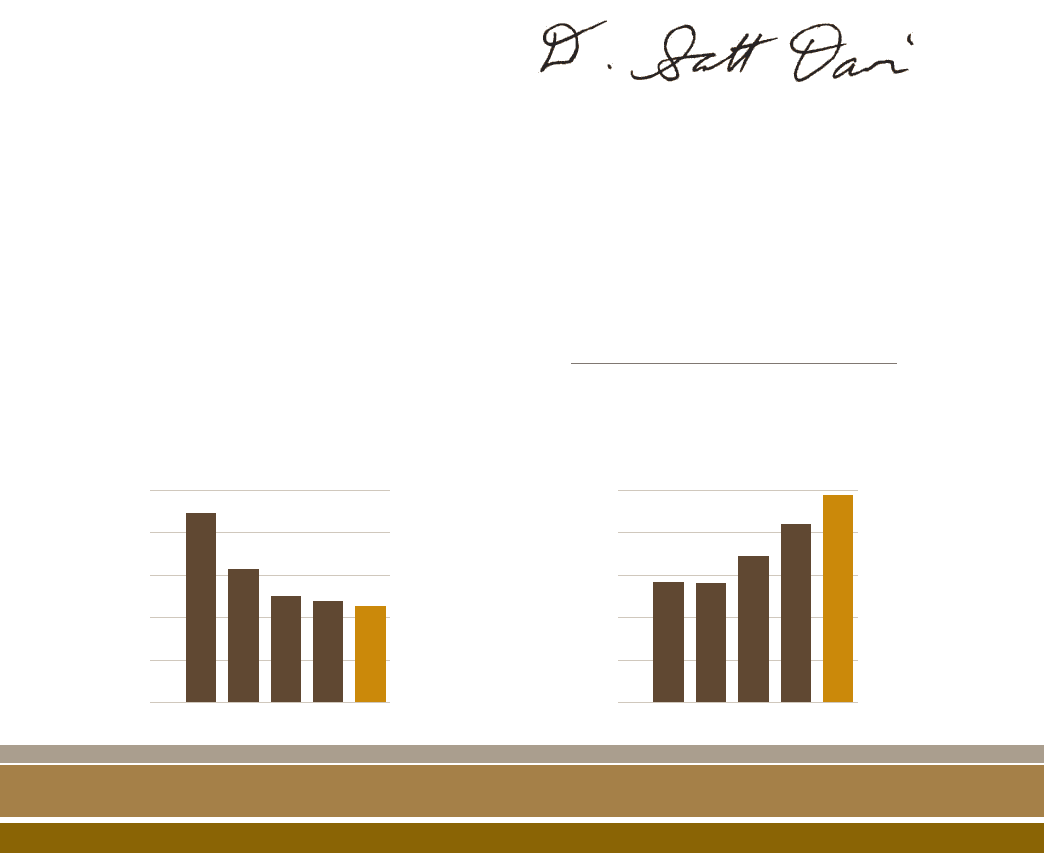
take advantage of our I.T. platform by linking their
systems directly into the UPS global network. This
seamless integration allows us to provide unique
solutions that help customers improve their
profi tability and access new markets.
All of this is supported by one of the most trusted
and recognized brands on the planet — a brand that
symbolizes UPS’s heritage of reliable service.
Consistent, superior fi nancial performance
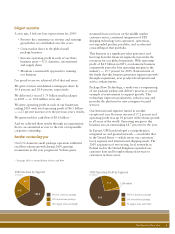
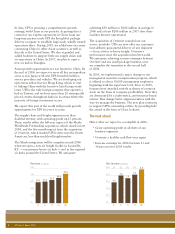
UPS has a track record of compelling fi nancial
performance. For example, return on equity has been
over 20 percent almost every year for the past two
decades, our compound annual earnings growth rate
is 14 percent for the last decade, and long-term debt
to total capitalization was only 15.8 percent in 2005.
Our business generates substantial, positive cash fl ow
that supports reinvestment in the business through
new technologies, infrastructure enhancements, new
services, and acquisitions. In 2005, UPS generated
$3.6 billion in free cash fl ow.*
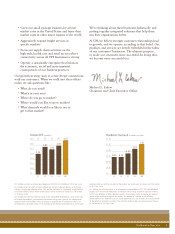
This fi nancial strength underscores a commitment to
shareowner value. In 2005, UPS spent $2.5 billion to
repurchase 33.9 million shares, reducing outstanding
shares by 2.6 percent. Over the last fi ve years (2001
through 2005), UPS has distributed over $5.4 billion
in dividends. In fact, from February 2003 to February
2006, UPS increased dividends declared 81 percent.
Decades of employee ownership have produced a
culture aligned with investor interests — UPS is a
company that’s run by investors for investors.
This ownership philosophy results in long-term
investment decision-making, with a focus on
appropriate investment returns.
Our business is straightforward. The balance sheet
provides a clear picture of our fi nancial strength. Since
we are a service company, we have minimal inventories
on hand, and our revenue recognition is easy to
understand. These characteristics of our business
result in a high level of transparency.
I speak for UPSers the world over when I say we’re
excited about the prospects afforded us in the
transportation industry. Our business both supports
and benefi ts from increased trade. As the world’s
communities move closer together economically,
we believe UPS is an exceptional way to invest in
global commerce.
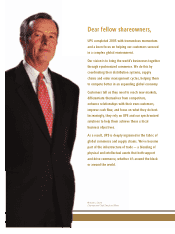
D. Scott Davis
Chief Financial Offi cer
*Reconciliation of 2005 Free Cash Flow (in millions)
Net cash from operations $ 5,793
Capital expenditures (2,187)
Proceeds from disposals of PP&E 27
Net change in fi nance receivables 95
Other investing activities (174)
Free cash fl ow $ 3,554
%
,
&)
'&
'-
(*
%*
%)%(%'
%&
Adc\"IZgb9ZWiid
IdiVa8Ve^iVa^oVi^dc^ceZgXZci
(&#'
&*#-
&+#+
&,#*
'&#.
%
(%%
+%%
.%%
&!'%%
&!*%%
%*
%)%(%'
%&
IdiVa9^k^YZcYhEV^Y^cb^aa^dch
-*+
&!)+-
&!'+'
&!%(,
-).
UPS Annual Report 2005
10


