UPS 2005 Annual Report Download - page 35
Download and view the complete annual report
Please find page 35 of the 2005 UPS annual report below. You can navigate through the pages in the report by either clicking on the pages listed below, or by using the keyword search tool below to find specific information within the annual report.-
 1
1 -
2
-
3
-
4
-
5
-
6
-
7
-
8
-
9
-
10
-
11
-
12
-
13
-
14
-
15
-
16
-
17
-
18
-
19
-
20
-
21
-
22
-
23
-
24
-
 25
25 -
 26
26 -
 27
27 -
 28
28 -
 29
29 -
 30
30 -
 31
31 -
 32
32 -
 33
33 -
 34
34 -
 35
35 -
 36
36 -
 37
37 -
 38
38 -
 39
39 -
 40
40 -
 41
41 -
 42
42 -
 43
43 -
 44
44 -
 45
45 -
46
-
47
-
48
-
49
-
50
-
51
-
52
-
53
-
54
-
55
-
56
-
57
-
58
-
59
-
60
-
61
-
62
-
63
-
64
-
65
-
66
-
67
-
68
-
69
-
70
-
71
-
72
-
73
-
74
-
75
-
76
-
77
-
78
-
79
-
80
-
81
-
82
-
83
-
84
-
85
-
86
-
87
-
88
-
89
-
90
-
91
-
92
-
93
-
94
-
95
-
96
-
97
-
98
-
99
-
100
-
101
-
102
-
103
-
104
 |
 |
U.S. Domestic Package Operations
2005 compared to 2004
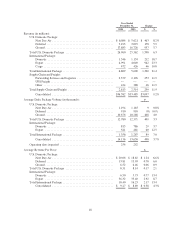
U.S. Domestic Package revenue increased $1.650 billion, or 6.1%, for the year, primarily due to a 3.4%
increase in average daily package volume and a 2.5% increase in revenue per piece. Ground volume grew 3.4%,
and was positively impacted by a solid U.S. economy and our focus on middle market sales initiatives. Next Day
Air volume grew 2.8% and deferred volume increased 4.0%, with growth in the manufacturing, business
services, telecommunications and retail sectors. The growth in total U.S. Domestic Package volume strengthened
throughout the year.
Ground revenue per piece increased 3.7% for the year, primarily due to the impact of a rate increase that
took effect in 2005, as well as the implementation of a fuel surcharge on ground products. Next Day Air revenue
per piece increased 2.0% for the year, primarily due to the rate increase and an increased fuel surcharge rate in
2005 compared to 2004. Next Day Air revenue per piece was adversely affected by relatively higher growth in
our Saver product. Both Next Day Air and deferred revenue per piece were adversely affected by lighter average
package weights.
On January 3, 2005, a rate increase took effect which was in line with previous years’ rate increases. We
increased rates 2.9% on UPS Next Day Air, UPS 2nd Day Air, UPS 3 Day Select, and UPS Ground. Other
pricing changes included an increase of $0.25 for delivery area surcharge on both residential and commercial
services to certain ZIP codes. The residential surcharge increased $0.10 for UPS Ground services and $0.35 for
UPS Next Day Air, UPS 2nd Day Air and UPS 3 Day Select.
In January 2005, we modified the fuel surcharge on domestic air services by setting a maximum cap of
9.50%, which was increased to 12.50% effective in October 2005. This fuel surcharge continues to be based on
the U.S. Energy Department’s Gulf Coast spot price for a gallon of kerosene-type jet fuel. Based on published
rates, the average fuel surcharge on domestic air products was 10.23% in 2005, as compared with 7.07% in 2004.
Additionally, an initial fuel surcharge of 2.00% was applied to UPS Ground services in January 2005, which
fluctuates based on the U.S. Energy Department’s On-Highway Diesel Fuel Price. Based on published rates, the
average fuel surcharge on domestic ground products was 2.90% in 2005. Total domestic fuel surcharge revenue
increased by $683 million for the year, due to higher jet and diesel fuel prices, volume increases, and the
modifications to our fuel surcharges noted above. These fuel surcharges are used to provide some protection
against the increased fuel expense that we incur due to higher fuel prices, as well as the increased purchased
transportation expense which is also affected by higher fuel prices.
U.S. Domestic Package operating profit increased $791 million, or 21.4%, for the year, and domestic
operating margin increased by 200 basis points. Operating profit increased by $274 million due to a change in
our Management Incentive Awards program (discussed below in “Operating Expenses”), which also favorably
impacted the operating margin. The remaining increase in operating profit and margin resulted from the revenue
growth described previously, as well as controlled growth of operating expenses.
2004 compared to 2003
U.S. Domestic Package revenue increased $1.598 billion, or 6.3%, for the year, which resulted from a 3.3%
increase in average daily package volume and a 2.1% increase in revenue per piece. Ground volume increased
4.0% during the year, driven in part by the improving U.S. economy, and reflects growth in both commercial and
residential deliveries. Ground volume increased 4.8% during the first nine months of the year, but slowed to
1.5% during the fourth quarter. Total Next Day Air volume (up 0.8%) and total deferred volume (down 0.9%)
were both significantly affected by declines in letter volume, but offset by an increase in Next Day Air package
volume. The 2004 decline in Next Day Air and deferred letter volume is largely due to the slowdown in
mortgage refinancing, which was notably strong in 2003.
20