UPS 2005 Annual Report Download - page 37
Download and view the complete annual report
Please find page 37 of the 2005 UPS annual report below. You can navigate through the pages in the report by either clicking on the pages listed below, or by using the keyword search tool below to find specific information within the annual report.-
 1
1 -
2
-
3
-
4
-
5
-
6
-
7
-
8
-
9
-
10
-
11
-
12
-
13
-
14
-
15
-
16
-
17
-
18
-
19
-
20
-
21
-
22
-
23
-
24
-
25
-
26
-
 27
27 -
 28
28 -
 29
29 -
 30
30 -
 31
31 -
 32
32 -
 33
33 -
 34
34 -
 35
35 -
 36
36 -
 37
37 -
 38
38 -
 39
39 -
 40
40 -
 41
41 -
 42
42 -
 43
43 -
 44
44 -
 45
45 -
 46
46 -
 47
47 -
48
-
49
-
50
-
51
-
52
-
53
-
54
-
55
-
56
-
57
-
58
-
59
-
60
-
61
-
62
-
63
-
64
-
65
-
66
-
67
-
68
-
69
-
70
-
71
-
72
-
73
-
74
-
75
-
76
-
77
-
78
-
79
-
80
-
81
-
82
-
83
-
84
-
85
-
86
-
87
-
88
-
89
-
90
-
91
-
92
-
93
-
94
-
95
-
96
-
97
-
98
-
99
-
100
-
101
-
102
-
103
-
104
 |
 |
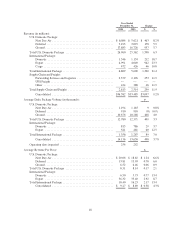
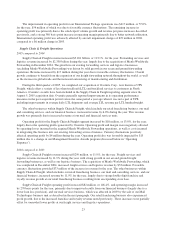
Export volume increased throughout the world, with strong growth in Asia and Europe. Asian export
volume, which increased 29% for the year, was driven by export growth from China. Asian export volume
continues to benefit from our expanding international delivery network, including the additional flights from
Shanghai, China that were added in the fourth quarter of 2004, and express air service between the U.S. and
Guangzhou, China that began in the second quarter of 2005. European export volume increased 13% for the year,
while export volume from the U.S. and Americas also showed solid increases. International domestic volume
increased 12.4% for the year, due to volume growth in Canada and Europe, which also benefited from the
acquisition of Messenger Service Stolica S.A. in Poland during the second quarter of 2005 and Lynx Express
Ltd. in the United Kingdom in the third quarter of 2005. Excluding the impact of acquisitions, international
domestic volume increased 3.7%.
Export revenue per piece increased 3.1% for the year (1.4% currency-adjusted), due to the rate increases
discussed previously and the impact of the fuel surcharge, but was adversely affected by relatively higher growth
in lower revenue per piece transborder product. In total, international average daily package volume increased
13.0% and average revenue per piece increased 4.0% (2.4% currency-adjusted).
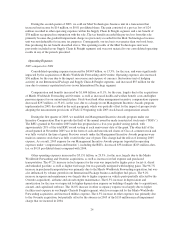
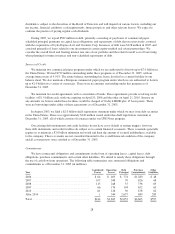
The improvement in operating profit for our International Package operations was $345 million for the year,
or 30.0%, with an increase in the operating margin of 180 basis points. This increase in operating profit and
margin was positively impacted by the strong volume growth described previously, as well as better network
utilization due to volume growth and geographic service expansion. The increase in operating profit was also
favorably affected by $78 million due to the impact of currency fluctuations on revenue and expense (net of
hedging activity), and by $45 million due to a change in our Management Incentive Awards program (discussed
below in “Operating Expenses”). Operating profit was negatively affected in 2005 by $23 million in currency
repatriation losses, as compared with repatriation gains of $32 million in 2004.
2004 compared to 2003
International Package revenue improved $1.200 billion, or 21.4%, for the year primarily due to the 12.5%
volume growth for our export products and strong revenue per piece improvements. Revenue increased $295
million during the year due to currency fluctuations. Revenue growth was also impacted by the change to our fuel
surcharge (discussed below) as well as rate changes, which vary by geographical market and occur throughout
the year. Rates for international shipments originating in the United States (Worldwide Express, Worldwide
Express Plus, UPS Worldwide Expedited and UPS International Standard service) increased an average of 3.5%.
In January 2004, changes were made to the calculation of our fuel surcharge on international products
(including U.S. export products). The surcharge began to be indexed to fuel prices in our different international
regions, depending on where the shipment takes place. The surcharge began to be applied only to our
international express products, while the previous surcharge was applied to all international products. These
changes, along with higher fuel prices, had the effect of increasing International Package revenue by $231
million during the year.
We experienced double-digit export volume growth in each region throughout the world, with the Asia-
Pacific region leading with 24% export volume growth, including a 101% increase in China export volume.
Export volume continued to benefit from our expanding international network, such as the six additional flights
to Shanghai, China that were added in the fourth quarter of 2004. European export volume grew in excess of
10%, and was positively influenced by the addition of 10 countries to the European Union during the year.
Non-U.S. domestic volume increased 3.7% for the year, and primarily reflected improvements in our European
and Canadian domestic delivery businesses.
Export revenue per piece increased 8.7% for the year (2.9% currency-adjusted), benefiting from rate
increases and the impact of the fuel surcharge. In total, international average daily package volume increased
7.0% and average revenue per piece increased 13.4% (6.5% currency-adjusted).
22