UPS 2005 Annual Report Download - page 73
Download and view the complete annual report
Please find page 73 of the 2005 UPS annual report below. You can navigate through the pages in the report by either clicking on the pages listed below, or by using the keyword search tool below to find specific information within the annual report.-
 1
1 -
2
-
3
-
4
-
5
-
6
-
7
-
8
-
9
-
10
-
11
-
12
-
13
-
14
-
15
-
16
-
17
-
18
-
19
-
20
-
21
-
22
-
23
-
24
-
25
-
26
-
27
-
28
-
29
-
30
-
31
-
32
-
33
-
34
-
35
-
36
-
37
-
38
-
39
-
40
-
41
-
42
-
43
-
44
-
45
-
46
-
47
-
48
-
49
-
50
-
51
-
52
-
53
-
54
-
55
-
56
-
57
-
58
-
59
-
60
-
61
-
62
-
 63
63 -
 64
64 -
 65
65 -
 66
66 -
 67
67 -
 68
68 -
 69
69 -
 70
70 -
 71
71 -
 72
72 -
 73
73 -
 74
74 -
 75
75 -
 76
76 -
 77
77 -
 78
78 -
 79
79 -
 80
80 -
 81
81 -
 82
82 -
 83
83 -
84
-
85
-
86
-
87
-
88
-
89
-
90
-
91
-
92
-
93
-
94
-
95
-
96
-
97
-
98
-
99
-
100
-
101
-
102
-
103
-
104
 |
 |

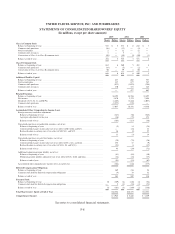
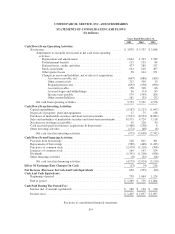
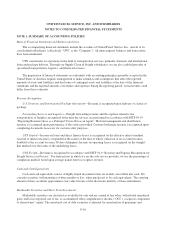
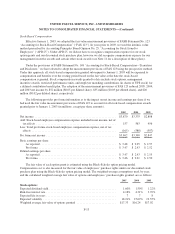
UNITED PARCEL SERVICE, INC. AND SUBSIDIARIES
NOTES TO CONSOLIDATED FINANCIAL STATEMENTS—(Continued)
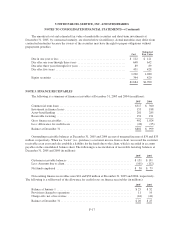
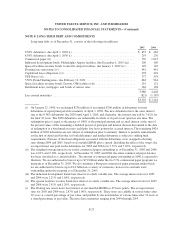
The amortized cost and estimated fair value of marketable securities and short-term investments at
December 31, 2005, by contractual maturity, are shown below (in millions). Actual maturities may differ from
contractual maturities because the issuers of the securities may have the right to prepay obligations without
prepayment penalties.
Cost
Estimated
Fair Value
Due in one year or less ............................................. $ 122 $ 121
Due after one year through three years ................................. 648 642
Due after three years through five years ................................ 89 89
Due after five years ................................................ 431 428
1,290 1,280
Equity securities .................................................. 394 420
$1,684 $1,700
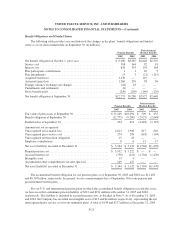
NOTE 3. FINANCE RECEIVABLES
The following is a summary of finance receivables at December 31, 2005 and 2004 (in millions):
2005 2004
Commercial term loans ................................................. $317 $ 360
Investment in finance leases ............................................. 153 188
Asset-based lending ................................................... 281 285
Receivable factoring ................................................... 151 191
Gross finance receivables ............................................... 902 1,024
Less: Allowance for credit losses ......................................... (20) (25)
Balance at December 31 ................................................ $882 $ 999
Outstanding receivable balances at December 31, 2005 and 2004 are net of unearned income of $34 and $35
million, respectively. When we “factor” (i.e., purchase) a customer invoice from a client, we record the customer
receivable as an asset and also establish a liability for the funds due to the client, which is recorded in accounts
payable on the consolidated balance sheet. The following is a reconciliation of receivable factoring balances at
December 31, 2005 and 2004 (in millions):
2005 2004
Customer receivable balances ........................................... $151 $191
Less: Amounts due to client ............................................. (101) (112)
Net funds employed ................................................... $ 50 $ 79
Non-earning finance receivables were $24 and $38 million at December 31, 2005 and 2004, respectively.
The following is a rollforward of the allowance for credit losses on finance receivables (in millions):
2005 2004
Balance at January 1 ................................................... $25 $52
Provisions charged to operations ......................................... 11 14
Charge-offs, net of recoveries ........................................... (16) (41)
Balance at December 31 ................................................ $20 $25
F-17