UPS 2005 Annual Report Download - page 33
Download and view the complete annual report
Please find page 33 of the 2005 UPS annual report below. You can navigate through the pages in the report by either clicking on the pages listed below, or by using the keyword search tool below to find specific information within the annual report.-
 1
1 -
2
-
3
-
4
-
5
-
6
-
7
-
8
-
9
-
10
-
11
-
12
-
13
-
14
-
15
-
16
-
17
-
18
-
19
-
20
-
21
-
22
-
 23
23 -
 24
24 -
 25
25 -
 26
26 -
 27
27 -
 28
28 -
 29
29 -
 30
30 -
 31
31 -
 32
32 -
 33
33 -
 34
34 -
 35
35 -
 36
36 -
 37
37 -
 38
38 -
 39
39 -
 40
40 -
 41
41 -
 42
42 -
 43
43 -
44
-
45
-
46
-
47
-
48
-
49
-
50
-
51
-
52
-
53
-
54
-
55
-
56
-
57
-
58
-
59
-
60
-
61
-
62
-
63
-
64
-
65
-
66
-
67
-
68
-
69
-
70
-
71
-
72
-
73
-
74
-
75
-
76
-
77
-
78
-
79
-
80
-
81
-
82
-
83
-
84
-
85
-
86
-
87
-
88
-
89
-
90
-
91
-
92
-
93
-
94
-
95
-
96
-
97
-
98
-
99
-
100
-
101
-
102
-
103
-
104
 |
 |

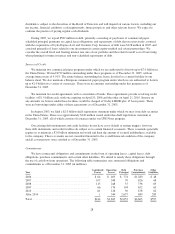
Year Ended
December 31, Change
2004 2003 $%
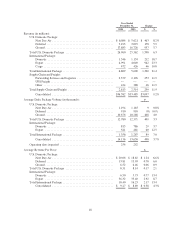
Revenue (in millions):
U.S. Domestic Package:
NextDayAir .......................................... $ 6,084 $ 5,621 $ 463 8.2%
Deferred .............................................. 3,193 3,015 178 5.9
Ground ............................................... 17,683 16,726 957 5.7
Total U.S. Domestic Package ................................. 26,960 25,362 1,598 6.3
International Package:
Domestic ............................................. 1,346 1,134 212 18.7
Export ............................................... 4,991 4,049 942 23.3
Cargo ................................................ 472 426 46 10.8
Total International Package ................................... 6,809 5,609 1,200 21.4
Supply Chain and Freight:
Forwarding Services and Logistics ......................... 2,379 2,126 253 11.9
UPSFreight ........................................... — — — —
Other ................................................ 434 388 46 11.9
Total Supply Chain and Freight ............................... 2,813 2,514 299 11.9
Consolidated .......................................... $36,582 $33,485 $3,097 9.2%
Average Daily Package Volume (in thousands): #
U.S. Domestic Package:
NextDayAir .......................................... 1,194 1,185 9 0.8%
Deferred .............................................. 910 918 (8) (0.9)
Ground ............................................... 10,676 10,268 408 4.0
Total U.S. Domestic Package ................................. 12,780 12,371 409 3.3
International Package:
Domestic ............................................. 815 786 29 3.7
Export ............................................... 541 481 60 12.5
Total International Package ................................... 1,356 1,267 89 7.0
Consolidated .......................................... 14,136 13,638 498 3.7%
Operating days in period ..................................... 254 252
Average Revenue Per Piece: $
U.S. Domestic Package:
NextDayAir .......................................... $ 20.06 $ 18.82 $ 1.24 6.6%
Deferred .............................................. 13.81 13.03 0.78 6.0
Ground ............................................... 6.52 6.46 0.06 0.9
Total U.S. Domestic Package ................................. 8.31 8.14 0.17 2.1
International Package:
Domestic ............................................. 6.50 5.73 0.77 13.4
Export ............................................... 36.32 33.40 2.92 8.7
Total International Package ................................... 18.40 16.23 2.17 13.4
Consolidated .......................................... $ 9.27 $ 8.89 $ 0.38 4.3%
18