UPS 2005 Annual Report Download - page 72
Download and view the complete annual report
Please find page 72 of the 2005 UPS annual report below. You can navigate through the pages in the report by either clicking on the pages listed below, or by using the keyword search tool below to find specific information within the annual report.-
 1
1 -
2
-
3
-
4
-
5
-
6
-
7
-
8
-
9
-
10
-
11
-
12
-
13
-
14
-
15
-
16
-
17
-
18
-
19
-
20
-
21
-
22
-
23
-
24
-
25
-
26
-
27
-
28
-
29
-
30
-
31
-
32
-
33
-
34
-
35
-
36
-
37
-
38
-
39
-
40
-
41
-
42
-
43
-
44
-
45
-
46
-
47
-
48
-
49
-
50
-
51
-
52
-
53
-
54
-
55
-
56
-
57
-
58
-
59
-
60
-
61
-
 62
62 -
 63
63 -
 64
64 -
 65
65 -
 66
66 -
 67
67 -
 68
68 -
 69
69 -
 70
70 -
 71
71 -
 72
72 -
 73
73 -
 74
74 -
 75
75 -
 76
76 -
 77
77 -
 78
78 -
 79
79 -
 80
80 -
 81
81 -
 82
82 -
83
-
84
-
85
-
86
-
87
-
88
-
89
-
90
-
91
-
92
-
93
-
94
-
95
-
96
-
97
-
98
-
99
-
100
-
101
-
102
-
103
-
104
 |
 |

UNITED PARCEL SERVICE, INC. AND SUBSIDIARIES
NOTES TO CONSOLIDATED FINANCIAL STATEMENTS—(Continued)
Cost
Unrealized
Gains
Unrealized
Losses
Estimated
Fair Value
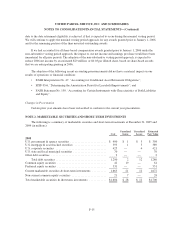
2004
U.S. government & agency securities ......................... $ 269 $ 1 $ 1 $ 269
U.S. mortgage & asset-backed securities ...................... 1,042 1 1 1,042
U.S. corporate securities ................................... 446 1 1 446
U.S. state and local municipal securities ....................... 1,098 — — 1,098
Other debt securities ...................................... 2 — — 2
Total debt securities ................................... 2,857 3 3 2,857
Common equity securities .................................. 63 14 — 77
Preferred equity securities .................................. 1,546 — 22 1,524
Current marketable securities & short-term investments .......... $4,458
Non-current common equity securities ........................ — — — —
Total marketable securities & short-term investments ............ $4,466 $ 17 $ 25 $4,458
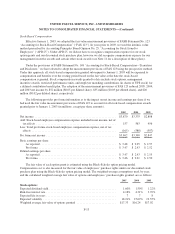
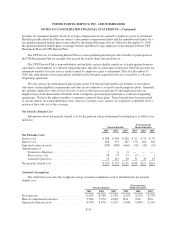
The gross realized gains on sales of marketable securities totaled $2, $7, and $21 million in 2005, 2004, and
2003, respectively. The gross realized losses totaled $12, $5, and $7 million in 2005, 2004, and 2003,
respectively. Impairment losses recognized on marketable securities and short-term investments totaled $16, $0,
and $58 million during 2005, 2004, and 2003, respectively.
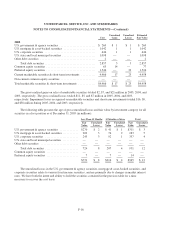
The following table presents the age of gross unrealized losses and fair value by investment category for all
securities in a loss position as of December 31, 2005 (in millions):
Less Than 12 Months 12 Months or More Total
Fair
Value
Unrealized
Losses
Fair
Value
Unrealized
Losses
Fair
Value
Unrealized
Losses
U.S. government & agency securities ............. $270 $ 2 $ 41 $ 1 $311 $ 3
U.S. mortgage & asset-backed securities ........... 209 3 74 2 283 5
U.S. corporate securities ....................... 245 3 92 1 337 4
U.S. state and local municipal securities ........... — — ————
Other debt securities .......................... — — ————
Total debt securities ....................... 724 8 207 4 931 12
Common equity securities ...................... — — ————
Preferred equity securities ...................... 7 — 7 — 14 —
$731 $ 8 $214 $ 4 $945 $ 12
The unrealized losses in the U.S. government & agency securities, mortgage & asset-backed securities, and
corporate securities relate to various fixed income securities, and are primarily due to changes in market interest
rates. We have both the intent and ability to hold the securities contained in the previous table for a time
necessary to recover the cost basis.
F-16
$17 $25$4,466