Toyota 2007 Annual Report Download - page 98
Download and view the complete annual report
Please find page 98 of the 2007 Toyota annual report below. You can navigate through the pages in the report by either clicking on the pages listed below, or by using the keyword search tool below to find specific information within the annual report.-
 1
1 -
2
-
3
-
4
-
5
-
6
-
7
-
8
-
9
-
10
-
11
-
12
-
13
-
14
-
15
-
16
-
17
-
18
-
19
-
20
-
21
-
22
-
23
-
24
-
25
-
26
-
27
-
28
-
29
-
30
-
31
-
32
-
33
-
34
-
35
-
36
-
37
-
38
-
39
-
40
-
41
-
42
-
43
-
44
-
45
-
46
-
47
-
48
-
49
-
50
-
51
-
52
-
53
-
54
-
55
-
56
-
57
-
58
-
59
-
60
-
61
-
62
-
63
-
64
-
65
-
66
-
67
-
68
-
69
-
70
-
71
-
72
-
73
-
74
-
75
-
76
-
77
-
78
-
79
-
80
-
81
-
82
-
83
-
84
-
85
-
86
-
87
-
 88
88 -
 89
89 -
 90
90 -
 91
91 -
 92
92 -
 93
93 -
 94
94 -
 95
95 -
 96
96 -
 97
97 -
 98
98 -
 99
99 -
 100
100 -
 101
101 -
 102
102 -
 103
103 -
 104
104 -
 105
105 -
 106
106 -
 107
107 -
 108
108 -
109
-
110
-
111
-
112
-
113
-
114
-
115
-
116
-
117
-
118
-
119
-
120
-
121
-
122
-
123
-
124
-
125
-
126
-
127
-
128
-
129
-
130
-
131
-
132
-
133
-
134
-
135
-
136
-
137
-
138
-
139
-
140
 |
 |

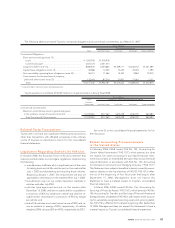
96 ANNUAL REPORT 200796 ANNUAL REPORT 2007
U.S. dollars
Yen in millions in millions
2005 2006 2007 2007
Net revenues
Sales of products ............................................................... ¥17,790,862 ¥20,059,493 ¥22,670,097 $192,038
Financing operations......................................................... 760,664 977,416 1,277,994 10,826
18,551,526 21,036,909 23,948,091 202,864
Costs and expenses
Cost of products sold........................................................ 14,500,282 16,335,312 18,356,255 155,495
Cost of financing operations ............................................ 369,844 609,632 872,138 7,388
Selling, general and administrative.................................. 2,009,213 2,213,623 2,481,015 21,017
16,879,339 19,158,567 21,709,408 183,900
Operating income................................................................ 1,672,187 1,878,342 2,238,683 18,964
Other income (expense)
Interest and dividend income........................................... 67,519 93,970 131,939 1,118
Interest expense ................................................................ (18,956) (21,601) (49,326) (418)
Foreign exchange gain, net.............................................. 21,419 10,789 33,005 279
Other income, net ............................................................. 12,468 125,860 28,215 239
82,450 209,018 143,833 1,218
Income before income taxes, minority interest and
equity in earnings of affiliated companies.................... 1,754,637 2,087,360 2,382,516 20,182
Provision for income taxes................................................. 657,910 795,153 898,312 7,609
Income before minority interest and equity
in earnings of affiliated companies ................................ 1,096,727 1,292,207 1,484,204 12,573
Minority interest in consolidated subsidiaries ............... (64,938) (84,393) (49,687) (421)
Equity in earnings of affiliated companies...................... 139,471 164,366 209,515 1,775
Net income ................................................................ ¥ 1,171,260 ¥ 1,372,180 ¥ 1,644,032 $ 13,927
Yen U.S. dollars
Net income per share
—Basic................................................................................ ¥355.35 ¥421.76 ¥512.09 $4.34
—Diluted ............................................................................ ¥355.28 ¥421.62 ¥511.80 $4.34
Cash dividends per share................................................... ¥ 65.00 ¥ 90.00 ¥120.00 $1.02
The accompanying notes are an integral part of these consolidated financial statements.
Consolidated Statements of Income
Toyota Motor Corporation
For the years ended March 31, 2005, 2006 and 2007