Toyota 2007 Annual Report Download - page 7
Download and view the complete annual report
Please find page 7 of the 2007 Toyota annual report below. You can navigate through the pages in the report by either clicking on the pages listed below, or by using the keyword search tool below to find specific information within the annual report.-
 1
1 -
 2
2 -
 3
3 -
 4
4 -
 5
5 -
 6
6 -
 7
7 -
 8
8 -
 9
9 -
 10
10 -
 11
11 -
 12
12 -
 13
13 -
 14
14 -
 15
15 -
 16
16 -
 17
17 -
 18
18 -
19
-
20
-
21
-
22
-
23
-
24
-
25
-
26
-
27
-
28
-
29
-
30
-
31
-
32
-
33
-
34
-
35
-
36
-
37
-
38
-
39
-
40
-
41
-
42
-
43
-
44
-
45
-
46
-
47
-
48
-
49
-
50
-
51
-
52
-
53
-
54
-
55
-
56
-
57
-
58
-
59
-
60
-
61
-
62
-
63
-
64
-
65
-
66
-
67
-
68
-
69
-
70
-
71
-
72
-
73
-
74
-
75
-
76
-
77
-
78
-
79
-
80
-
81
-
82
-
83
-
84
-
85
-
86
-
87
-
88
-
89
-
90
-
91
-
92
-
93
-
94
-
95
-
96
-
97
-
98
-
99
-
100
-
101
-
102
-
103
-
104
-
105
-
106
-
107
-
108
-
109
-
110
-
111
-
112
-
113
-
114
-
115
-
116
-
117
-
118
-
119
-
120
-
121
-
122
-
123
-
124
-
125
-
126
-
127
-
128
-
129
-
130
-
131
-
132
-
133
-
134
-
135
-
136
-
137
-
138
-
139
-
140
 |
 |
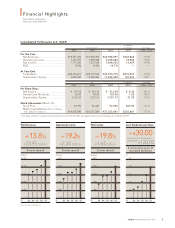
ANNUAL REPORT 2007 5
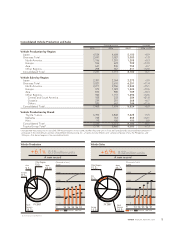
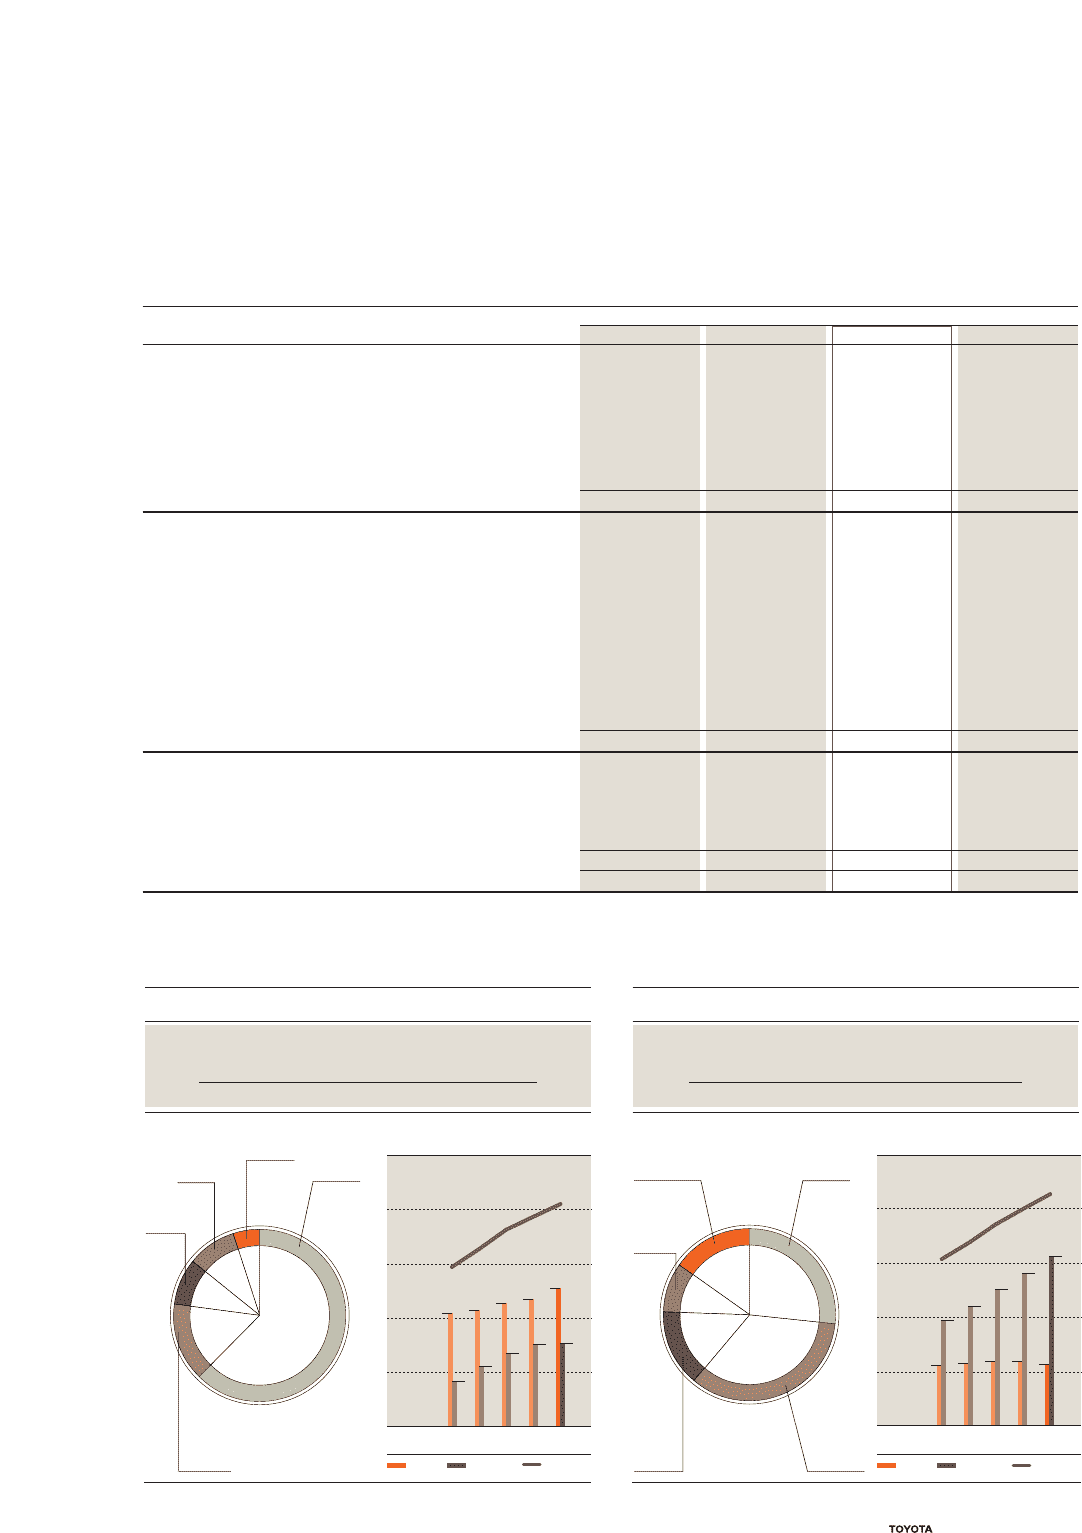
Consolidated Vehicle Production and Sales
Thousands of units % change
2005 2006 2007 2006 vs 2007
Vehicle Production by Region:
Japan................................................................................ 4,534 4,684 5,100 +8.9
Overseas Total ................................................................ 2,697 3,027 3,080 +1.8
North America ............................................................. 1,156 1,201 1,205 +0.3
Europe.......................................................................... 596 623 709 +13.9
Asia ............................................................................... 647 836 755 –9.7
Other Regions ............................................................. 298 367 411 +12.0
Consolidated Total ......................................................... 7,231 7,711 8,180 +6.1
Vehicle Sales by Region:
Japan................................................................................ 2,381 2,364 2,273 –3.9
Overseas Total ................................................................ 5,027 5,610 6,251 +11.4
North America ............................................................. 2,271 2,556 2,942 +15.1
Europe.......................................................................... 979 1,023 1,224 +19.6
Asia ............................................................................... 833 880 789 –10.3
Other Regions ............................................................. 944 1,151 1,296 +12.6
Central and South America..................................... 185 233 284 +21.8
Oceania .................................................................... 239 251 268 +6.7
Others....................................................................... 520 667 744 +11.6
Consolidated Total ......................................................... 7,408 7,974 8,524 +6.9
Vehicle Production by Brand:
Toyota / Lexus ............................................................. 6,393 6,848 7,225 +5.5
Daihatsu ....................................................................... 745 763 855 +12.1
Hino .............................................................................. 93 100 100 0.0
Consolidated Total ......................................................... 7,231 7,711 8,180 +6.1
Toyota Group Total*....................................................... 7,719 8,460 9,080 +7.3
* Includes 488 thousand units in fiscal 2005, 749 thousand units in fiscal 2006, and 900 thousand units in fiscal 2007 produced by unconsolidated companies—
principally in the United States (at New United Motor Manufacturing, Inc., a Toyota-General Motors joint venture company), China, the Philippines, and
Malaysia—that do not appear in the consolidated totals.
4,000
2,000
8,000
6,000
10,000
4,000
2,000
8,000
6,000
10,000
00
(Thousands of units)
FY
Europe
8.7%
Other Regions
5.0%Japan
62.4%
Asia
9.2%
North
America
14.7%
Vehicle Production
A new record
+6.1% 8.18 million units
Overseas TotalJapan
Vehicle Sales
A new record
+6.9% 8.52 million units
8.18 million units 8.52 million units
FY 2007
(Thousands of units)
FY
Europe
14.3%
Other Regions
15.2%
Japan
26.7%
Asia
9.3%
North
America
34.5%Overseas TotalJapan
FY 2007
’03 ’04 ’05 ’06 ’07 ’03 ’04 ’05 ’06 ’07
Note: Fiscal years ended March 31